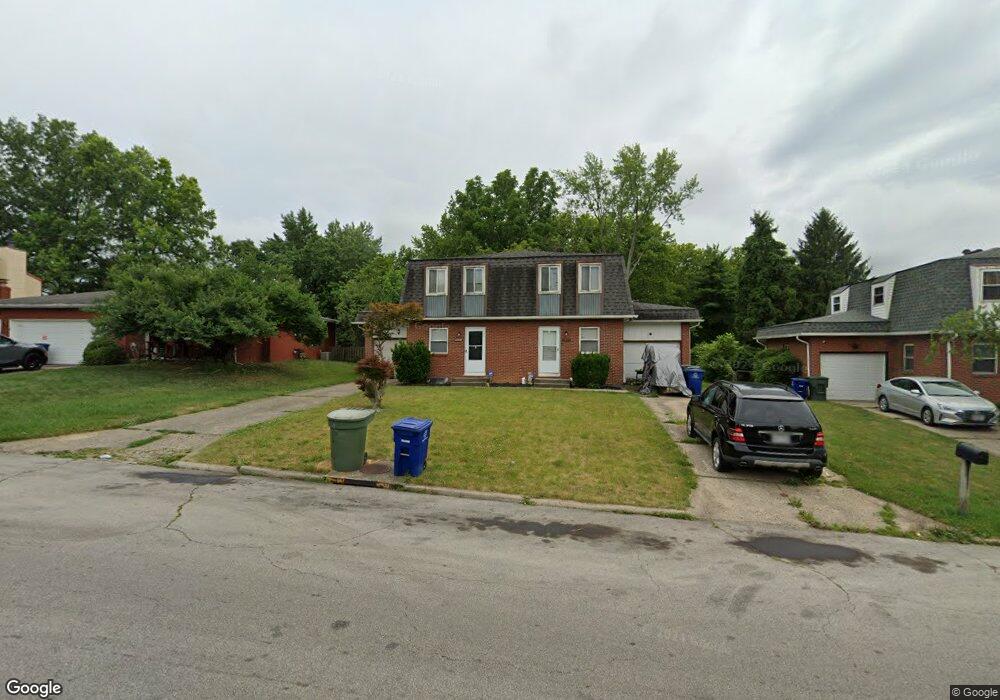
5655 Saranac Dr Unit 657 Columbus, OH 43232
Walnut Hills NeighborhoodEstimated Value: $316,524 - $376,000
5
Beds
4
Baths
2,512
Sq Ft
$136/Sq Ft
Est. Value
About This Home
This home is located at 5655 Saranac Dr Unit 657, Columbus, OH 43232 and is currently estimated at $341,631, approximately $135 per square foot. 5655 Saranac Dr Unit 657 is a home located in Franklin County with nearby schools including Oakmont Elementary School, Yorktown Middle School, and Independence High School.
Ownership History
Date
Name
Owned For
Owner Type
Purchase Details
Closed on
Aug 23, 2002
Sold by
Slade Denise C
Bought by
Braima Bobby B
Current Estimated Value
Purchase Details
Closed on
Jan 21, 1997
Sold by
Hanrahan Timothy P
Bought by
Slade Michael E and Slade Denise C
Home Financials for this Owner
Home Financials are based on the most recent Mortgage that was taken out on this home.
Original Mortgage
$96,800
Interest Rate
7.75%
Mortgage Type
New Conventional
Purchase Details
Closed on
Mar 11, 1996
Sold by
Lane Lillian F
Bought by
Hanrahan Timothy P and Hanrahan Jane A
Home Financials for this Owner
Home Financials are based on the most recent Mortgage that was taken out on this home.
Original Mortgage
$10,000
Interest Rate
7.05%
Mortgage Type
New Conventional
Create a Home Valuation Report for This Property
The Home Valuation Report is an in-depth analysis detailing your home's value as well as a comparison with similar homes in the area
Home Values in the Area
Average Home Value in this Area
Purchase History
| Date | Buyer | Sale Price | Title Company |
|---|---|---|---|
| Braima Bobby B | $140,000 | Titlequest | |
| Slade Michael E | $115,000 | -- | |
| Hanrahan Timothy P | $36,900 | -- |
Source: Public Records
Mortgage History
| Date | Status | Borrower | Loan Amount |
|---|---|---|---|
| Previous Owner | Slade Michael E | $96,800 | |
| Previous Owner | Hanrahan Timothy P | $10,000 |
Source: Public Records
Tax History Compared to Growth
Tax History
| Year | Tax Paid | Tax Assessment Tax Assessment Total Assessment is a certain percentage of the fair market value that is determined by local assessors to be the total taxable value of land and additions on the property. | Land | Improvement |
|---|---|---|---|---|
| 2024 | $4,124 | $90,930 | $22,400 | $68,530 |
| 2023 | $4,072 | $90,930 | $22,400 | $68,530 |
| 2022 | $2,165 | $41,230 | $8,050 | $33,180 |
| 2021 | $2,169 | $41,230 | $8,050 | $33,180 |
| 2020 | $2,172 | $41,230 | $8,050 | $33,180 |
| 2019 | $2,201 | $35,840 | $7,000 | $28,840 |
| 2018 | $2,593 | $35,840 | $7,000 | $28,840 |
| 2017 | $2,744 | $35,840 | $7,000 | $28,840 |
| 2016 | $3,288 | $49,010 | $8,440 | $40,570 |
| 2015 | $2,989 | $49,010 | $8,440 | $40,570 |
| 2014 | $2,997 | $49,010 | $8,440 | $40,570 |
| 2013 | $1,478 | $49,000 | $8,435 | $40,565 |
Source: Public Records
Map
Nearby Homes
- 5596 Autumn Chase Dr
- 1930 Walnut Hill Park Dr
- 1942 Bairsford Dr Unit 944
- 1835 Woodette Rd
- 1718 Sunapple Way
- 1759 Lonsdale Rd
- 1591 Stephanie Ct Unit 15912
- 5337 Ivyhurst Dr
- 5366 Yorkshire Village Ln Unit B-22
- 5846 Riverton Rd
- 0 Radekin Rd Unit 225029852
- 1616 Coppertree Rd Unit 1615
- 1314 Yorkland Rd Unit C
- 0 Brice Rd
- 6156 Roselawn Ave
- 1945 Riverdale Rd
- 5036 Brinwood Place
- 6348 E Livingston Ave
- 2293 Ayers Dr
- 1486 Efner Dr
- 5647-5649 Saranac Dr
- 5647 Saranac Dr Unit 649
- 5663 Saranac Dr Unit 665
- 5663 Saranac Dr Unit 5665
- 5663-5665 Saranac Dr
- 1806 Bairsford Dr
- 5673 Saranac Dr
- 5671 Saranac Dr Unit 673
- 5671 Saranac Dr Unit 5673
- 5671-5673 Saranac Dr
- 1806-1808 Bairsford Dr
- 1808 Bairsford Dr
- 1814 Bairsford Dr Unit 816
- 1903 Birkdale Dr
- 1901 Birkdale Dr
- 5679 Saranac Dr Unit 681
- 1905 Birkdale Dr
- 1820 Bairsford Dr Unit 822
- 1822 Bairsford Dr
- 1899 Birkdale Dr