5656 Wyant Ln Charlottesville, VA 22903
Southwest Charlottesville NeighborhoodEstimated Value: $1,129,394 - $1,409,000
4
Beds
4
Baths
3,536
Sq Ft
$347/Sq Ft
Est. Value
About This Home
This home is located at 5656 Wyant Ln, Charlottesville, VA 22903 and is currently estimated at $1,227,131, approximately $347 per square foot. 5656 Wyant Ln is a home located in Albemarle County with nearby schools including Brownsville Elementary School, Joseph T. Henley Middle School, and Western Albemarle High School.
Ownership History
Date
Name
Owned For
Owner Type
Purchase Details
Closed on
Jun 14, 2016
Sold by
Gieck Joe H
Bought by
Heverly Benjamin R and Heverly Kimberly A
Current Estimated Value
Home Financials for this Owner
Home Financials are based on the most recent Mortgage that was taken out on this home.
Original Mortgage
$126,000
Outstanding Balance
$100,315
Interest Rate
3.58%
Mortgage Type
New Conventional
Estimated Equity
$1,126,816
Create a Home Valuation Report for This Property
The Home Valuation Report is an in-depth analysis detailing your home's value as well as a comparison with similar homes in the area
Home Values in the Area
Average Home Value in this Area
Purchase History
| Date | Buyer | Sale Price | Title Company |
|---|---|---|---|
| Heverly Benjamin R | $165,000 | Old Republic National Title |
Source: Public Records
Mortgage History
| Date | Status | Borrower | Loan Amount |
|---|---|---|---|
| Open | Heverly Benjamin R | $126,000 |
Source: Public Records
Tax History
| Year | Tax Paid | Tax Assessment Tax Assessment Total Assessment is a certain percentage of the fair market value that is determined by local assessors to be the total taxable value of land and additions on the property. | Land | Improvement |
|---|---|---|---|---|
| 2025 | $9,116 | $1,019,700 | $173,900 | $845,800 |
| 2024 | $8,584 | $1,005,100 | $168,200 | $836,900 |
| 2023 | $8,362 | $979,100 | $165,400 | $813,700 |
| 2022 | $7,588 | $888,500 | $165,400 | $723,100 |
| 2021 | $7,029 | $823,100 | $151,100 | $672,000 |
| 2020 | $6,973 | $816,500 | $147,500 | $669,000 |
| 2019 | $6,749 | $790,300 | $151,100 | $639,200 |
| 2018 | $1,214 | $155,600 | $151,100 | $4,500 |
| 2017 | $1,123 | $133,900 | $129,400 | $4,500 |
| 2016 | $1,488 | $177,400 | $172,900 | $4,500 |
| 2015 | -- | $0 | $0 | $0 |
Source: Public Records
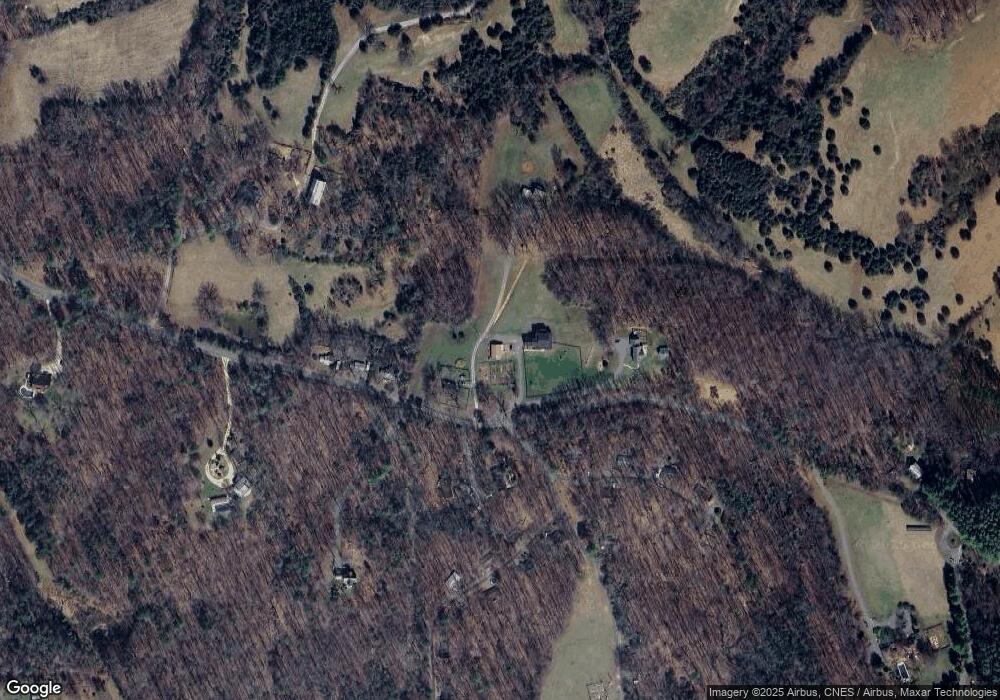
Map
Nearby Homes
- 5498 Wyant Ln
- 5864 Wyant Ln
- 582 Miller School Rd
- 0 Midway Rd Unit 669632
- 318 Miller School Rd
- 445 Burchs Creek Rd
- 395 Burchs Creek Rd
- 5302 Little Fox Ln
- 6 Warwick Dr Unit Lot 6
- 6 Warwick Dr
- 4 Warwick Dr
- 12 Warwick Dr
- 2A Corsham St
- 2C Corsham St
- 2E Corsham St
- 29 Portelet Rd
- 52 Borthwick St
- 6812 Chancery Ln
- 2B Corsham St
- 20 Warwick Dr
Your Personal Tour Guide
Ask me questions while you tour the home.