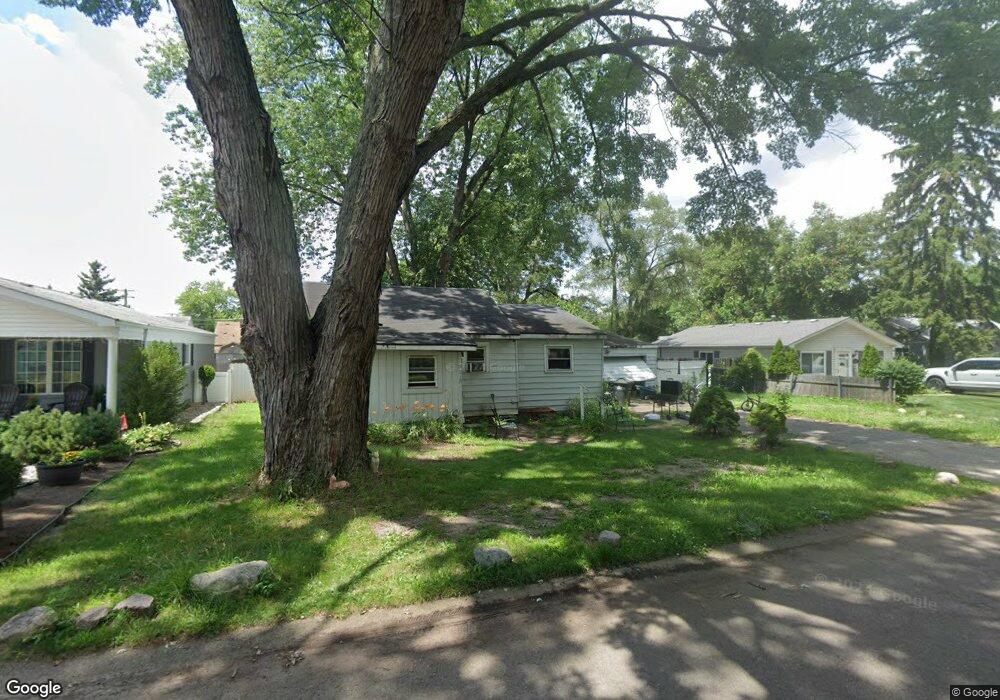
5657 N Parent St Westland, MI 48185
Estimated Value: $159,710 - $178,000
3
Beds
1
Bath
950
Sq Ft
$176/Sq Ft
Est. Value
About This Home
This home is located at 5657 N Parent St, Westland, MI 48185 and is currently estimated at $167,428, approximately $176 per square foot. 5657 N Parent St is a home located in Wayne County with nearby schools including Wildwood Elementary School, Marshall Upper Elementary School, and Adlai Stevenson Middle School.
Ownership History
Date
Name
Owned For
Owner Type
Purchase Details
Closed on
Mar 18, 2019
Sold by
Anderson Jay R
Bought by
Anderson Jay R
Current Estimated Value
Purchase Details
Closed on
Aug 9, 2011
Sold by
Secretary Of Housing & Urban Development
Bought by
Anderson Jay R
Purchase Details
Closed on
Jan 6, 2011
Sold by
Wells Fargo Bank Na
Bought by
The Secretary Of Housing & Urban Develop
Purchase Details
Closed on
Jun 23, 2010
Sold by
Norsworthy Steve O
Bought by
Wells Fargo Bank Na
Purchase Details
Closed on
Jan 24, 2004
Sold by
Spirko Shannon
Bought by
Norsworthy Ii Steve O
Purchase Details
Closed on
Aug 22, 2002
Sold by
Radke Kristine M
Bought by
Norsworthy Steve O
Purchase Details
Closed on
Jun 26, 1997
Sold by
Kenneth P and Kenneth Michelle L
Bought by
Radke Kristine M and Radke William D
Purchase Details
Closed on
Jun 19, 1995
Sold by
Robert L Adams
Bought by
Sparks Kenneth P Beasley and Sparks Michelle L
Create a Home Valuation Report for This Property
The Home Valuation Report is an in-depth analysis detailing your home's value as well as a comparison with similar homes in the area
Home Values in the Area
Average Home Value in this Area
Purchase History
| Date | Buyer | Sale Price | Title Company |
|---|---|---|---|
| Anderson Jay R | -- | None Listed On Document | |
| Anderson Jay R | $18,800 | None Available | |
| The Secretary Of Housing & Urban Develop | -- | None Available | |
| Wells Fargo Bank Na | $105,718 | None Available | |
| Norsworthy Ii Steve O | $1,825 | Transnation Title | |
| Norsworthy Steve O | $104,000 | -- | |
| Radke Kristine M | $78,000 | -- | |
| Sparks Kenneth P Beasley | $63,000 | -- |
Source: Public Records
Tax History Compared to Growth
Tax History
| Year | Tax Paid | Tax Assessment Tax Assessment Total Assessment is a certain percentage of the fair market value that is determined by local assessors to be the total taxable value of land and additions on the property. | Land | Improvement |
|---|---|---|---|---|
| 2025 | $1,123 | $69,400 | $0 | $0 |
| 2024 | $1,123 | $69,500 | $0 | $0 |
| 2023 | $1,073 | $61,700 | $0 | $0 |
| 2022 | $1,227 | $55,200 | $0 | $0 |
| 2021 | $1,615 | $51,200 | $0 | $0 |
| 2020 | $1,186 | $44,200 | $0 | $0 |
| 2019 | $1,140 | $40,500 | $0 | $0 |
| 2018 | $882 | $36,100 | $0 | $0 |
| 2017 | $377 | $34,000 | $0 | $0 |
| 2016 | $1,141 | $33,000 | $0 | $0 |
| 2015 | $2,114 | $28,060 | $0 | $0 |
| 2013 | $2,048 | $29,010 | $0 | $0 |
| 2012 | $2,135 | $20,000 | $0 | $0 |
Source: Public Records
Map
Nearby Homes
- 35833 Ford Rd
- 35754 Castlewood Ct
- 35737 Hunter Ave
- 6546 Quail Run Cir
- 34802 Pardo St
- 35863 Hunter Ave Unit 34
- 34752 John Hauk St
- 1654 Shoemaker Dr Unit 145
- 0 N Wayne Rd
- 7051 Wayne Rd
- 1309 Shoemaker Dr
- 1680 N Hanlon St
- 1605 N Hanlon St
- 0 Dowling Ave
- 6145 N Dowling St
- 6026 Wilmer St
- 35209 Sheridan St
- 35228 Rosslyn St
- 6541 Pembrook Dr
- 5692 N Globe St
- 5647 N Parent St
- 5635 N Parent St
- 5683 N Parent St Unit Bldg-Unit
- 5683 N Parent St
- 5701 N Parent St
- 5650 N Karle St
- 5664 N Karle St
- 5632 N Karle St
- 5668 N Karle St
- 5670 N Parent St
- 5634 N Parent St
- 5672 N Karle St
- 5743 N Parent St
- 5710 N Parent St
- 35526 Ford Rd
- 5730 N Parent St
- 5649 N Karle St Unit Bldg-Unit
- 5649 N Karle St
- 5657 N Karle St
- 5641 N Karle St