Estimated Value: $383,177 - $399,000
4
Beds
2
Baths
928
Sq Ft
$421/Sq Ft
Est. Value
About This Home
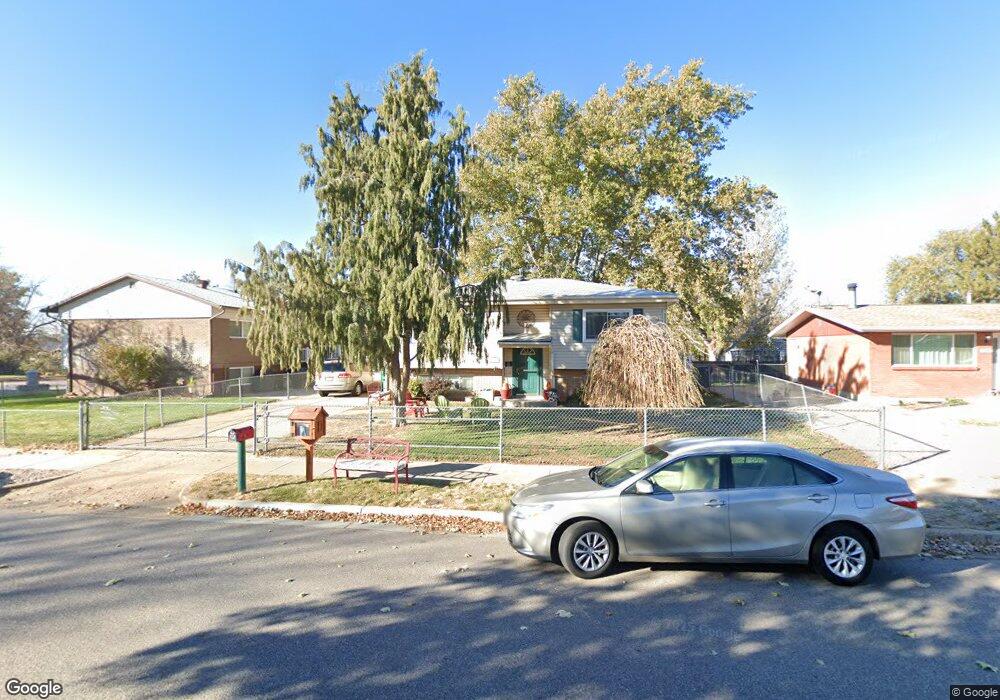
This home is located at 5659 S 2775 W, Roy, UT 84067 and is currently estimated at $390,794, approximately $421 per square foot. 5659 S 2775 W is a home located in Weber County with nearby schools including Roy Elementary School, Roy Junior High School, and Roy High School.
Ownership History
Date
Name
Owned For
Owner Type
Purchase Details
Closed on
Sep 6, 2002
Sold by
Schenk Michael R and Schenk Valarie
Bought by
Schenk Michael and Schenk Valarie
Current Estimated Value
Home Financials for this Owner
Home Financials are based on the most recent Mortgage that was taken out on this home.
Original Mortgage
$88,000
Interest Rate
6.37%
Purchase Details
Closed on
Jun 15, 1999
Sold by
Wasuita Sandra
Bought by
Schenk Michael R and Schenk Valarie
Home Financials for this Owner
Home Financials are based on the most recent Mortgage that was taken out on this home.
Original Mortgage
$104,295
Interest Rate
7.01%
Mortgage Type
FHA
Create a Home Valuation Report for This Property
The Home Valuation Report is an in-depth analysis detailing your home's value as well as a comparison with similar homes in the area
Home Values in the Area
Average Home Value in this Area
Purchase History
| Date | Buyer | Sale Price | Title Company |
|---|---|---|---|
| Schenk Michael | -- | Founders Title | |
| Schenk Michael R | -- | U S Title |
Source: Public Records
Mortgage History
| Date | Status | Borrower | Loan Amount |
|---|---|---|---|
| Closed | Schenk Michael | $88,000 | |
| Closed | Schenk Michael R | $104,295 | |
| Closed | Schenk Michael | $16,500 |
Source: Public Records
Tax History Compared to Growth
Tax History
| Year | Tax Paid | Tax Assessment Tax Assessment Total Assessment is a certain percentage of the fair market value that is determined by local assessors to be the total taxable value of land and additions on the property. | Land | Improvement |
|---|---|---|---|---|
| 2025 | $2,305 | $359,920 | $116,169 | $243,751 |
| 2024 | $2,251 | $194,699 | $63,906 | $130,793 |
| 2023 | $2,273 | $198,000 | $64,894 | $133,106 |
| 2022 | $2,120 | $188,651 | $53,730 | $134,921 |
| 2021 | $1,828 | $268,000 | $63,339 | $204,661 |
| 2020 | $1,676 | $225,000 | $63,339 | $161,661 |
| 2019 | $1,568 | $197,000 | $38,660 | $158,340 |
| 2018 | $1,418 | $166,000 | $35,740 | $130,260 |
| 2017 | $1,393 | $153,130 | $34,800 | $118,330 |
| 2016 | $1,293 | $75,904 | $18,898 | $57,006 |
| 2015 | $1,125 | $66,475 | $18,898 | $47,577 |
| 2014 | $1,100 | $64,128 | $18,898 | $45,230 |
Source: Public Records
Map
Nearby Homes