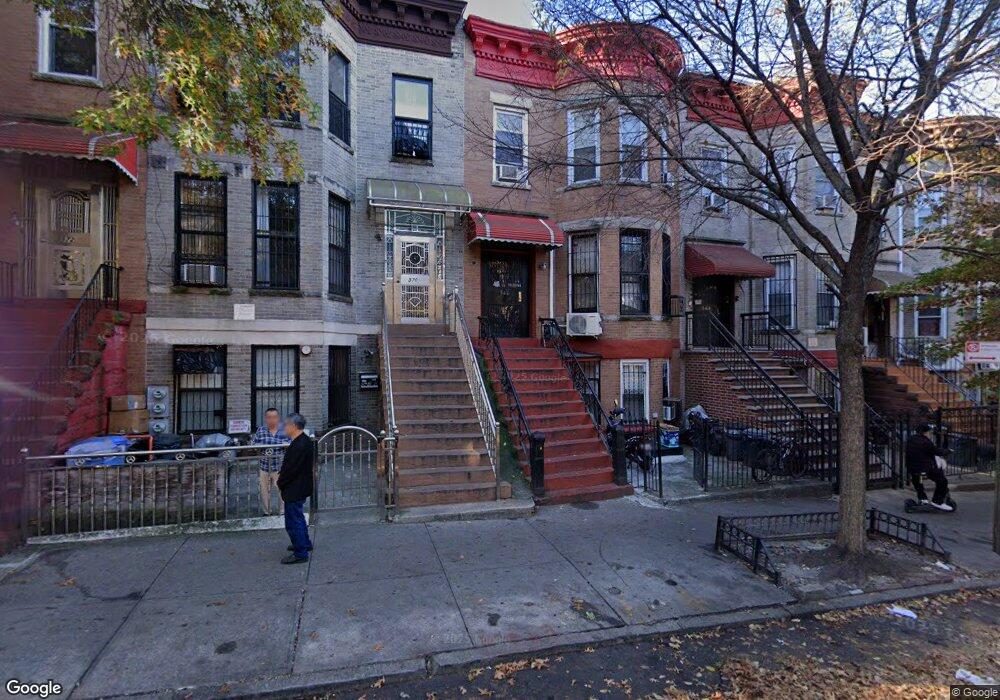
566 53rd St Brooklyn, NY 11220
Sunset Park NeighborhoodEstimated Value: $1,416,000 - $1,644,000
--
Bed
--
Bath
2,520
Sq Ft
$603/Sq Ft
Est. Value
About This Home
This home is located at 566 53rd St, Brooklyn, NY 11220 and is currently estimated at $1,520,575, approximately $603 per square foot. 566 53rd St is a home located in Kings County with nearby schools including P.S. 94 The Henry Longfellow School, IS 220 John J. Pershing, and Leep Dual Language Academy Charter School.
Ownership History
Date
Name
Owned For
Owner Type
Purchase Details
Closed on
Aug 27, 2020
Sold by
Song Kai Lan
Bought by
Song Kai Lan
Current Estimated Value
Purchase Details
Closed on
Jun 4, 2004
Sold by
Chan Shu Man
Bought by
Lo Hang H and Song Kai Lan
Home Financials for this Owner
Home Financials are based on the most recent Mortgage that was taken out on this home.
Original Mortgage
$427,000
Outstanding Balance
$210,412
Interest Rate
6.12%
Mortgage Type
Purchase Money Mortgage
Estimated Equity
$1,310,163
Purchase Details
Closed on
Dec 30, 1996
Sold by
Toro Bernice
Bought by
Tang Yuk Lin Chan and Chan Shu Man
Home Financials for this Owner
Home Financials are based on the most recent Mortgage that was taken out on this home.
Original Mortgage
$100,000
Interest Rate
7.78%
Create a Home Valuation Report for This Property
The Home Valuation Report is an in-depth analysis detailing your home's value as well as a comparison with similar homes in the area
Home Values in the Area
Average Home Value in this Area
Purchase History
| Date | Buyer | Sale Price | Title Company |
|---|---|---|---|
| Song Kai Lan | -- | -- | |
| Lo Hang H | $567,000 | -- | |
| Tang Yuk Lin Chan | $200,000 | First American Title Ins Co |
Source: Public Records
Mortgage History
| Date | Status | Borrower | Loan Amount |
|---|---|---|---|
| Open | Lo Hang H | $427,000 | |
| Previous Owner | Tang Yuk Lin Chan | $100,000 |
Source: Public Records
Tax History Compared to Growth
Tax History
| Year | Tax Paid | Tax Assessment Tax Assessment Total Assessment is a certain percentage of the fair market value that is determined by local assessors to be the total taxable value of land and additions on the property. | Land | Improvement |
|---|---|---|---|---|
| 2025 | $7,715 | $80,640 | $27,540 | $53,100 |
| 2024 | $7,715 | $78,900 | $27,540 | $51,360 |
| 2023 | $7,639 | $69,720 | $27,540 | $42,180 |
| 2022 | $7,223 | $72,480 | $27,540 | $44,940 |
| 2021 | $7,328 | $76,380 | $27,540 | $48,840 |
| 2020 | $3,531 | $78,480 | $27,540 | $50,940 |
| 2019 | $6,647 | $70,440 | $27,540 | $42,900 |
| 2018 | $6,330 | $32,512 | $10,152 | $22,360 |
| 2017 | $6,091 | $31,351 | $11,002 | $20,349 |
| 2016 | $5,725 | $30,190 | $13,401 | $16,789 |
| 2015 | $3,347 | $29,306 | $14,180 | $15,126 |
| 2014 | $3,347 | $27,648 | $16,060 | $11,588 |
Source: Public Records
Map
Nearby Homes