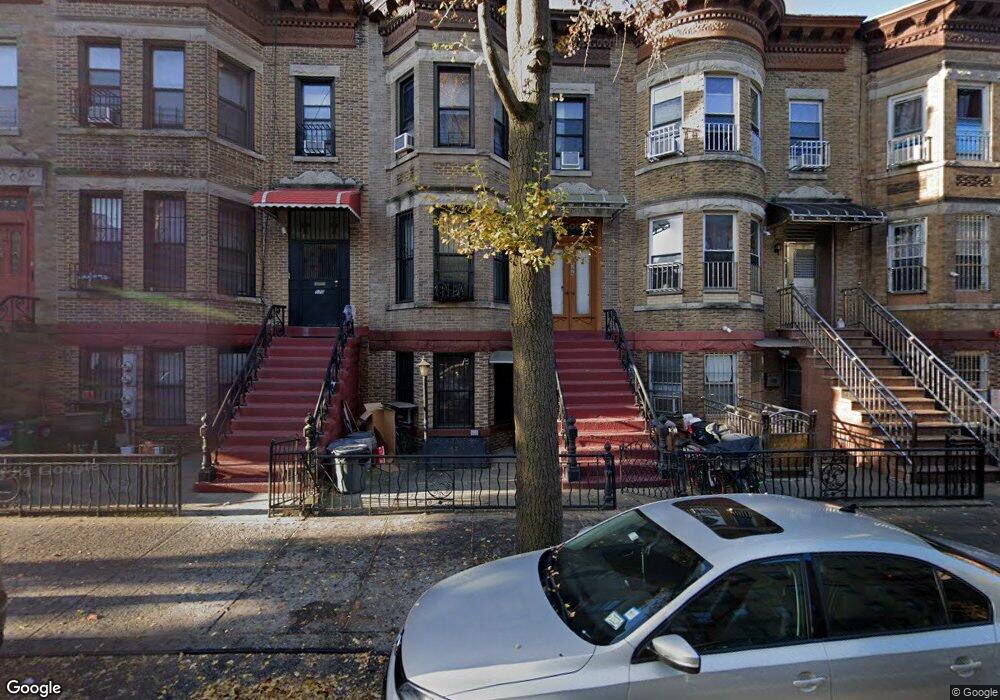
566 58th St Brooklyn, NY 11220
Sunset Park NeighborhoodEstimated Value: $1,505,085 - $1,749,000
--
Bed
--
Bath
2,796
Sq Ft
$579/Sq Ft
Est. Value
About This Home
This home is located at 566 58th St, Brooklyn, NY 11220 and is currently estimated at $1,618,021, approximately $578 per square foot. 566 58th St is a home located in Kings County with nearby schools including P.S. 506: The School of Journalism & Technology, IS 220 John J. Pershing, and Fort Hamilton High School.
Ownership History
Date
Name
Owned For
Owner Type
Purchase Details
Closed on
Feb 16, 1996
Sold by
Tong Chuen Chung
Bought by
Peng Wei Min and Chen Xiao Ling
Current Estimated Value
Home Financials for this Owner
Home Financials are based on the most recent Mortgage that was taken out on this home.
Original Mortgage
$145,000
Outstanding Balance
$4,740
Interest Rate
7%
Estimated Equity
$1,613,281
Create a Home Valuation Report for This Property
The Home Valuation Report is an in-depth analysis detailing your home's value as well as a comparison with similar homes in the area
Home Values in the Area
Average Home Value in this Area
Purchase History
| Date | Buyer | Sale Price | Title Company |
|---|---|---|---|
| Peng Wei Min | $198,000 | -- |
Source: Public Records
Mortgage History
| Date | Status | Borrower | Loan Amount |
|---|---|---|---|
| Open | Peng Wei Min | $145,000 |
Source: Public Records
Tax History Compared to Growth
Tax History
| Year | Tax Paid | Tax Assessment Tax Assessment Total Assessment is a certain percentage of the fair market value that is determined by local assessors to be the total taxable value of land and additions on the property. | Land | Improvement |
|---|---|---|---|---|
| 2025 | $8,391 | $89,940 | $29,400 | $60,540 |
| 2024 | $8,391 | $84,720 | $29,400 | $55,320 |
| 2023 | $7,916 | $99,180 | $29,400 | $69,780 |
| 2022 | $7,218 | $78,960 | $29,400 | $49,560 |
| 2021 | $7,998 | $79,440 | $29,400 | $50,040 |
| 2020 | $7,998 | $82,080 | $29,400 | $52,680 |
| 2019 | $7,283 | $82,200 | $29,400 | $52,800 |
| 2018 | $6,695 | $32,844 | $16,372 | $16,472 |
| 2017 | $6,492 | $31,849 | $17,634 | $14,215 |
| 2016 | $6,367 | $31,849 | $14,991 | $16,858 |
| 2015 | $2,269 | $30,752 | $18,622 | $12,130 |
| 2014 | $2,269 | $29,012 | $19,424 | $9,588 |
Source: Public Records
Map
Nearby Homes