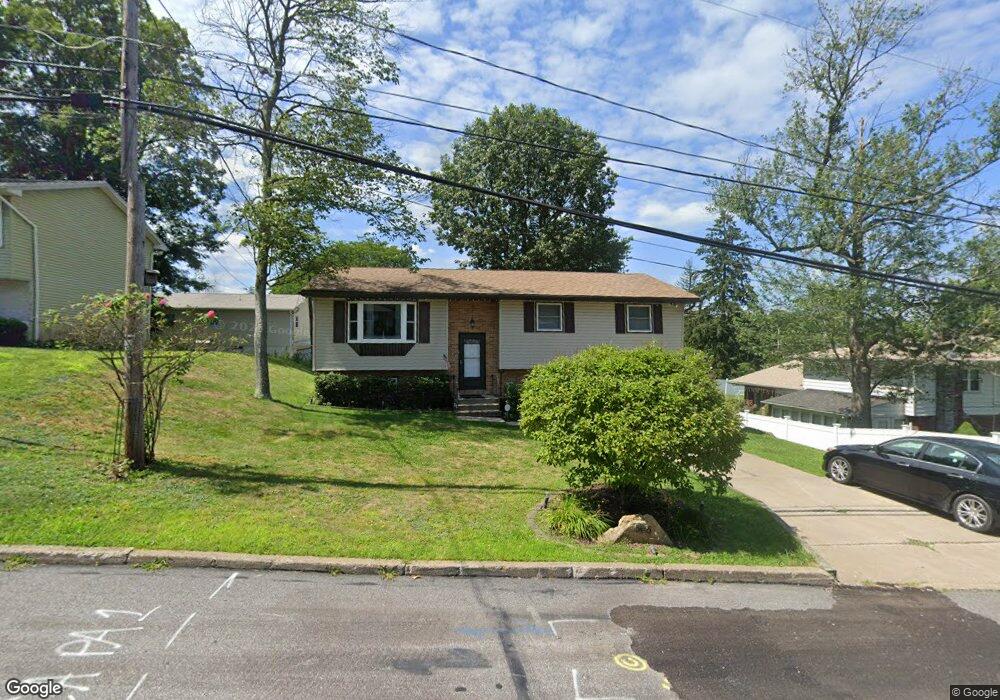
566 Allen St Hazleton, PA 18202
Estimated Value: $214,945 - $264,000
--
Bed
--
Bath
1,854
Sq Ft
$133/Sq Ft
Est. Value
About This Home
This home is located at 566 Allen St, Hazleton, PA 18202 and is currently estimated at $246,736, approximately $133 per square foot. 566 Allen St is a home located in Luzerne County with nearby schools including Hazleton Area High School, Immanuel Christian School, and Bishop Hafey Junior/Senior High School.
Ownership History
Date
Name
Owned For
Owner Type
Purchase Details
Closed on
Aug 30, 2021
Sold by
Mcgarry Michael Thomas and Mcgarry Elizabeth Ann
Bought by
Vercusky Thomas M
Current Estimated Value
Purchase Details
Closed on
Jun 25, 2016
Sold by
Mcgarry Michael T and Mcgarry Elizabeth Ann
Bought by
Mcgarry Michael Thomas and Mcgarry Elizabeth Ann
Purchase Details
Closed on
Oct 21, 2005
Sold by
Mcgarry Rebecca S
Bought by
Mcgarry Michael T
Home Financials for this Owner
Home Financials are based on the most recent Mortgage that was taken out on this home.
Original Mortgage
$120,000
Interest Rate
2.25%
Mortgage Type
Assumption
Create a Home Valuation Report for This Property
The Home Valuation Report is an in-depth analysis detailing your home's value as well as a comparison with similar homes in the area
Home Values in the Area
Average Home Value in this Area
Purchase History
| Date | Buyer | Sale Price | Title Company |
|---|---|---|---|
| Vercusky Thomas M | $180,000 | None Available | |
| Mcgarry Michael Thomas | -- | Attorney | |
| Mcgarry Michael T | -- | Fidelity Closing Services Ll |
Source: Public Records
Mortgage History
| Date | Status | Borrower | Loan Amount |
|---|---|---|---|
| Previous Owner | Mcgarry Michael T | $120,000 |
Source: Public Records
Tax History Compared to Growth
Tax History
| Year | Tax Paid | Tax Assessment Tax Assessment Total Assessment is a certain percentage of the fair market value that is determined by local assessors to be the total taxable value of land and additions on the property. | Land | Improvement |
|---|---|---|---|---|
| 2025 | $2,018 | $99,200 | $31,700 | $67,500 |
| 2024 | $1,936 | $99,200 | $31,700 | $67,500 |
| 2023 | $1,898 | $99,200 | $31,700 | $67,500 |
| 2022 | $1,879 | $99,200 | $31,700 | $67,500 |
| 2021 | $1,822 | $99,200 | $31,700 | $67,500 |
| 2020 | $1,789 | $99,200 | $31,700 | $67,500 |
| 2019 | $1,714 | $99,200 | $31,700 | $67,500 |
| 2018 | $1,649 | $99,200 | $31,700 | $67,500 |
| 2017 | $1,614 | $99,200 | $31,700 | $67,500 |
| 2016 | -- | $99,200 | $31,700 | $67,500 |
| 2015 | $1,070 | $99,200 | $31,700 | $67,500 |
| 2014 | $1,070 | $99,200 | $31,700 | $67,500 |
Source: Public Records
Map
Nearby Homes
- 609 Landmesser Ave
- 425 Anchor St
- 9 Park St
- 60 E Jefferson Ave
- 31 Park St
- 124 Putnam St
- 667 Roosevelt St
- 307 W Green St
- 756 Peace St
- 590 Mckinley St
- 0 Pennsylvania 93
- 118 E Green St
- 328 W Green St
- 782 N James St
- 111 S Broad St
- 1009 Peace St
- 329 Ridge Ave
- 882 N Locust St
- 1 W Diamond Ave
- 536 W Green St