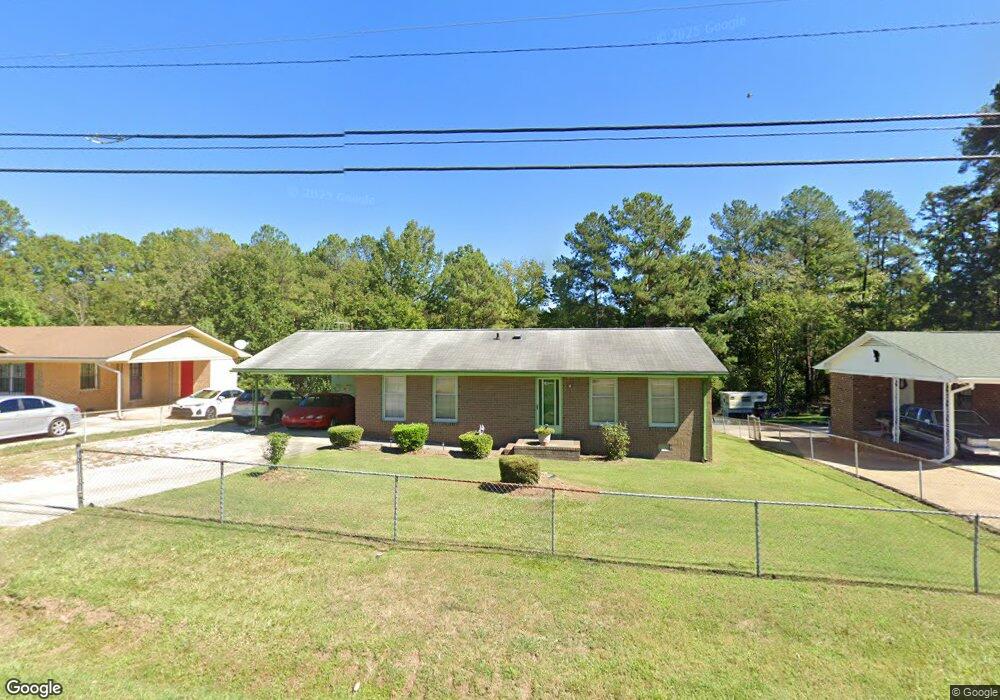
566 Clayton Rd Durham, NC 27703
Eastern Durham NeighborhoodEstimated Value: $251,000 - $284,000
3
Beds
2
Baths
1,232
Sq Ft
$217/Sq Ft
Est. Value
About This Home
This home is located at 566 Clayton Rd, Durham, NC 27703 and is currently estimated at $267,381, approximately $217 per square foot. 566 Clayton Rd is a home located in Durham County with nearby schools including Glenn Elementary, John W Neal Middle School, and Southern School of Energy & Sustainability.
Ownership History
Date
Name
Owned For
Owner Type
Purchase Details
Closed on
Dec 14, 2015
Sold by
Berman Gary K
Bought by
Berman Gary K and Berman Elizabeth J
Current Estimated Value
Purchase Details
Closed on
Jun 24, 2014
Sold by
Berman Stanley Miles and Berman Gary Keith
Bought by
Berman Gary Keith
Create a Home Valuation Report for This Property
The Home Valuation Report is an in-depth analysis detailing your home's value as well as a comparison with similar homes in the area
Home Values in the Area
Average Home Value in this Area
Purchase History
| Date | Buyer | Sale Price | Title Company |
|---|---|---|---|
| Berman Gary K | -- | Attorney | |
| Berman Gary Keith | -- | None Available |
Source: Public Records
Tax History
| Year | Tax Paid | Tax Assessment Tax Assessment Total Assessment is a certain percentage of the fair market value that is determined by local assessors to be the total taxable value of land and additions on the property. | Land | Improvement |
|---|---|---|---|---|
| 2025 | $2,407 | $242,768 | $83,200 | $159,568 |
| 2024 | $1,914 | $137,180 | $25,620 | $111,560 |
| 2023 | $1,797 | $137,180 | $25,620 | $111,560 |
| 2022 | $1,756 | $137,180 | $25,620 | $111,560 |
| 2021 | $1,748 | $137,180 | $25,620 | $111,560 |
| 2020 | $1,706 | $137,180 | $25,620 | $111,560 |
| 2019 | $1,706 | $137,180 | $25,620 | $111,560 |
| 2018 | $1,593 | $117,464 | $25,620 | $91,844 |
| 2017 | $1,582 | $117,464 | $25,620 | $91,844 |
| 2016 | $1,528 | $117,464 | $25,620 | $91,844 |
| 2015 | $1,652 | $119,363 | $24,482 | $94,881 |
| 2014 | $1,652 | $119,363 | $24,482 | $94,881 |
Source: Public Records
Map
Nearby Homes
- 709 Grandview Dr
- 3201 Venus Dr
- 7 Mercury Ct
- 3511 Thornwood Dr
- 403 Chadbourne Dr
- 912 Obsidian Way
- 3602 Thornwood Dr
- 703 Chopper Ln Unit 12
- 1007 Shovelhead Dr
- 1002 Alpha Dr
- 209 Fountain St
- 217 Fountain St
- 3708 Thornwood Dr
- 507 Lodestone Dr
- 3033 Fenimore St
- 1025 Sweet Cream Ct
- 521 Quartz Dr
- 1113 Homecoming Way
- 3409 Judy Ave
- 608 Chalcedony Ct
- 564 Clayton Rd
- 570 Clayton Rd
- 5 Newland Place
- 6 Newland Place
- 574 Clayton Rd
- 3 Newland Place
- 565 Clayton Rd
- 571 Clayton Rd
- 561 Clayton Rd
- 4 Newland Place
- 600 Clayton Rd
- 5 Thebes Place
- 559 Clayton Rd
- 1108 Clayton Rd
- 205 Clayton Rd
- 633 & 631 Clayton Rd
- 716 Chandler Rd
- 1 Newland Place
- 3 Thebes Place
- 701 Greyson Dr
Your Personal Tour Guide
Ask me questions while you tour the home.