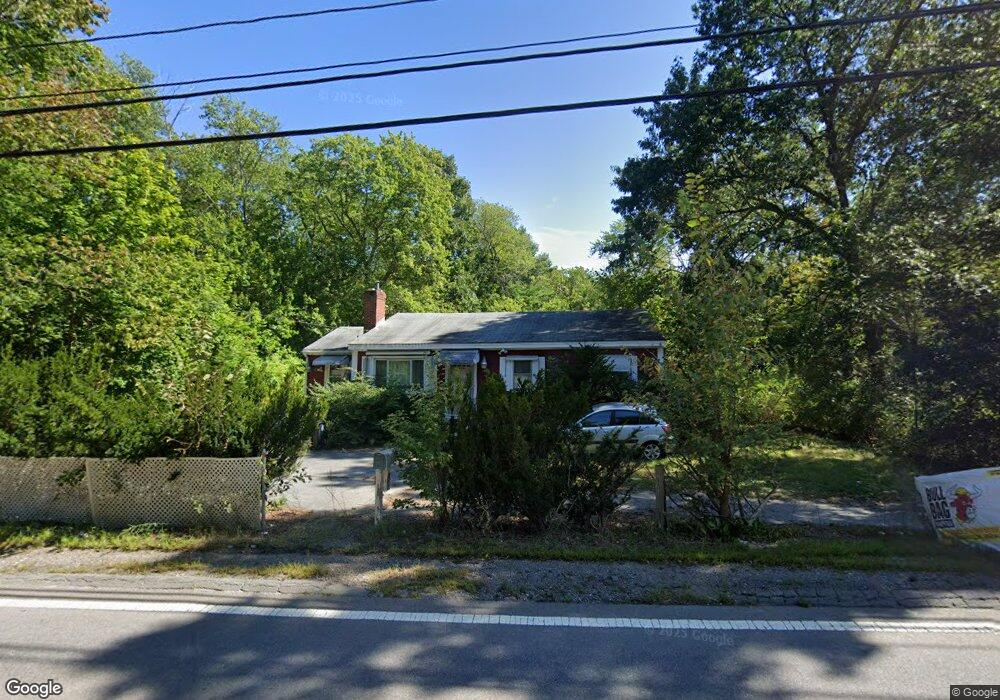
566 Dedham St Wrentham, MA 02093
Estimated Value: $447,000 - $519,258
4
Beds
1
Bath
1,223
Sq Ft
$390/Sq Ft
Est. Value
About This Home
This home is located at 566 Dedham St, Wrentham, MA 02093 and is currently estimated at $477,565, approximately $390 per square foot. 566 Dedham St is a home located in Norfolk County with nearby schools including Delaney Elementary School, Charles E Roderick, and Foxborough Regional Charter School.
Ownership History
Date
Name
Owned For
Owner Type
Purchase Details
Closed on
Oct 29, 2015
Sold by
Lecuyer Edgar J and Lecuyer Anne
Bought by
Amrhein Walter P
Current Estimated Value
Home Financials for this Owner
Home Financials are based on the most recent Mortgage that was taken out on this home.
Original Mortgage
$152,000
Outstanding Balance
$120,081
Interest Rate
3.92%
Mortgage Type
New Conventional
Estimated Equity
$357,484
Create a Home Valuation Report for This Property
The Home Valuation Report is an in-depth analysis detailing your home's value as well as a comparison with similar homes in the area
Purchase History
| Date | Buyer | Sale Price | Title Company |
|---|---|---|---|
| Amrhein Walter P | $160,000 | -- |
Source: Public Records
Mortgage History
| Date | Status | Borrower | Loan Amount |
|---|---|---|---|
| Open | Amrhein Walter P | $152,000 |
Source: Public Records
Tax History
| Year | Tax Paid | Tax Assessment Tax Assessment Total Assessment is a certain percentage of the fair market value that is determined by local assessors to be the total taxable value of land and additions on the property. | Land | Improvement |
|---|---|---|---|---|
| 2025 | $5,036 | $434,500 | $225,700 | $208,800 |
| 2024 | $4,642 | $386,800 | $225,700 | $161,100 |
| 2023 | $4,374 | $346,600 | $205,100 | $141,500 |
| 2022 | $4,506 | $329,600 | $199,600 | $130,000 |
| 2021 | $4,366 | $310,300 | $186,500 | $123,800 |
| 2020 | $3,776 | $265,000 | $142,400 | $122,600 |
| 2019 | $3,712 | $262,900 | $142,400 | $120,500 |
| 2018 | $3,731 | $262,000 | $142,400 | $119,600 |
| 2017 | $3,537 | $248,200 | $139,700 | $108,500 |
| 2016 | $3,456 | $242,000 | $135,600 | $106,400 |
| 2015 | $3,314 | $221,200 | $130,400 | $90,800 |
| 2014 | $3,259 | $212,900 | $125,400 | $87,500 |
Source: Public Records
Map
Nearby Homes
- 11 Weber Farm Rd Unit 11
- 8 Weber Farm Rd Unit 8
- 30 Weber Farm Rd Unit 30
- 9 Sharon Ave
- 11 Sharon Ave
- 0 W Birch Rd
- 25 Foxboro Rd
- 7 Hill St Unit 12
- 7 Hill St Unit 16
- 75 Foxboro Rd
- 246 Forest Grove Ave
- 65 Foxboro Rd
- 131 Washington St Unit 42
- 131 Washington St Unit 50
- 155 Clark Rd Unit 155
- 10 Nature View Dr
- 15 Nature View Dr
- 11 Goodwin Dr
- 287 Park St
- 45 Joshua Rd
- 569 Dedham St
- 563 Dedham St
- 572 Dedham St
- 546 Dedham St
- 560 Dedham St
- 562 Dedham St Unit 562
- 570 Dedham St
- 568 Dedham St
- 550 Dedham St
- 550 Dedham St Unit 1
- 578 Dedham St
- 576 Dedham St
- 574 Dedham St
- 584 Dedham St
- 582 Dedham St
- 580 Dedham St
- 590 Dedham St
- 588 Dedham St
- 586 Dedham St
- 588 Dedham St Unit 588
Your Personal Tour Guide
Ask me questions while you tour the home.