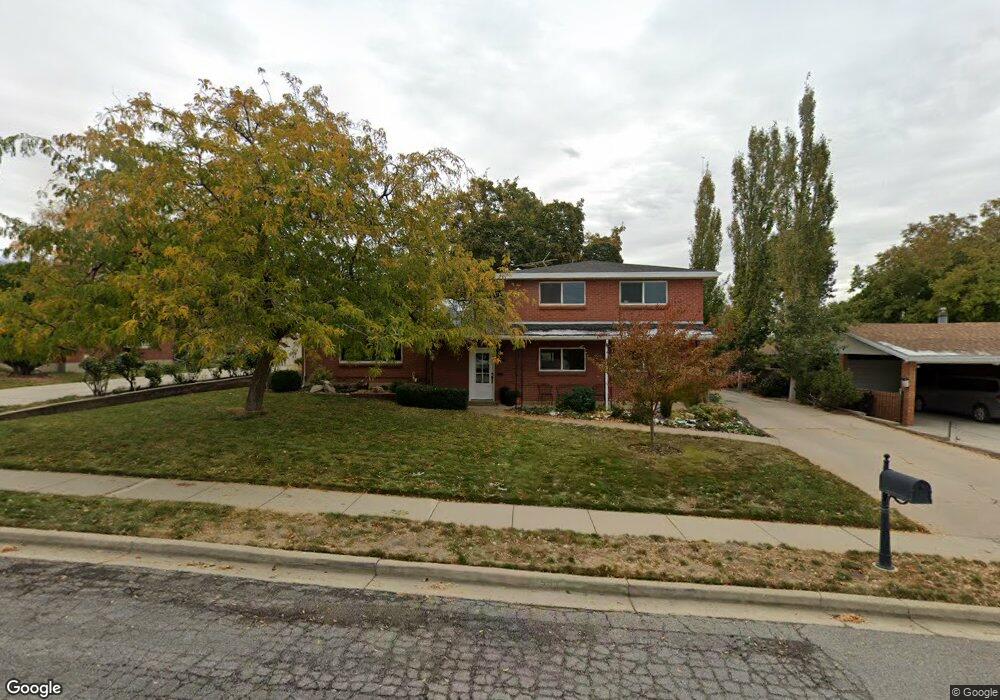
566 E 200 N Bountiful, UT 84010
Estimated Value: $598,000 - $645,000
5
Beds
2
Baths
2,373
Sq Ft
$260/Sq Ft
Est. Value
About This Home
This home is located at 566 E 200 N, Bountiful, UT 84010 and is currently estimated at $616,641, approximately $259 per square foot. 566 E 200 N is a home located in Davis County with nearby schools including Holbrook Elementary School, Bountiful Junior High School, and Bountiful High School.
Ownership History
Date
Name
Owned For
Owner Type
Purchase Details
Closed on
Feb 7, 2023
Sold by
Larson Jared B and Larson Tracy C
Bought by
Larson Family Asset Protection Trust
Current Estimated Value
Purchase Details
Closed on
Apr 11, 2005
Sold by
Leoroy E Holmes Family Trust and Holmes Michael R
Bought by
Larson Jared B and Larson Tracy C
Home Financials for this Owner
Home Financials are based on the most recent Mortgage that was taken out on this home.
Original Mortgage
$175,750
Interest Rate
5.84%
Mortgage Type
New Conventional
Purchase Details
Closed on
Oct 29, 1996
Sold by
Holmes Leroy E and Holmes Donna W
Bought by
Holmes Leroy E and Holmes Donna W
Create a Home Valuation Report for This Property
The Home Valuation Report is an in-depth analysis detailing your home's value as well as a comparison with similar homes in the area
Purchase History
| Date | Buyer | Sale Price | Title Company |
|---|---|---|---|
| Larson Family Asset Protection Trust | -- | -- | |
| Larson Jared B | -- | None Available | |
| County Of Davis | -- | None Available | |
| Holmes Leroy E | -- | Western States Title Company |
Source: Public Records
Mortgage History
| Date | Status | Borrower | Loan Amount |
|---|---|---|---|
| Previous Owner | County Of Davis | $175,750 |
Source: Public Records
Tax History
| Year | Tax Paid | Tax Assessment Tax Assessment Total Assessment is a certain percentage of the fair market value that is determined by local assessors to be the total taxable value of land and additions on the property. | Land | Improvement |
|---|---|---|---|---|
| 2025 | $3,521 | $313,500 | $163,123 | $150,377 |
| 2024 | $3,341 | $308,551 | $149,903 | $158,648 |
| 2023 | $3,186 | $534,000 | $278,365 | $255,635 |
| 2022 | $3,368 | $310,750 | $149,155 | $161,595 |
| 2021 | $2,897 | $408,000 | $222,257 | $185,743 |
| 2020 | $2,576 | $363,000 | $202,229 | $160,771 |
| 2019 | $2,639 | $364,000 | $184,854 | $179,146 |
| 2018 | $2,486 | $337,000 | $173,608 | $163,392 |
| 2016 | $2,175 | $159,830 | $61,380 | $98,450 |
| 2015 | $2,127 | $147,400 | $62,038 | $85,362 |
| 2014 | $2,067 | $147,461 | $62,038 | $85,423 |
| 2013 | -- | $135,603 | $55,655 | $79,948 |
Source: Public Records
Map
Nearby Homes
- 683 E 100 N
- 129 N 800 E
- 6 N 800 E
- 513 N 400 E Unit 14B
- 698 E 200 S
- 453 N 400 E Unit 7-D
- 255 E 400 S
- 456 E 500 S
- 520 S Orchard Dr Unit 17
- 49 E 200 N Unit 4
- 41 E 200 N Unit 6
- 55 E 200 N Unit 2
- 51 E 200 N Unit 3
- 254 N Main St
- 256 N Main St
- 252 N Main St
- 357 S 100 E
- 275 E Peach Ln S
- 17 E 400 N Unit 19B
- 323 Peach Ln
Your Personal Tour Guide
Ask me questions while you tour the home.