566 E Shore Rd Kings Point, NY 11024
Highlights
- In Ground Pool
- Waterfront
- Radiant Floor
- John F Kennedy School Rated A+
- Colonial Architecture
- Main Floor Bedroom
About This Home
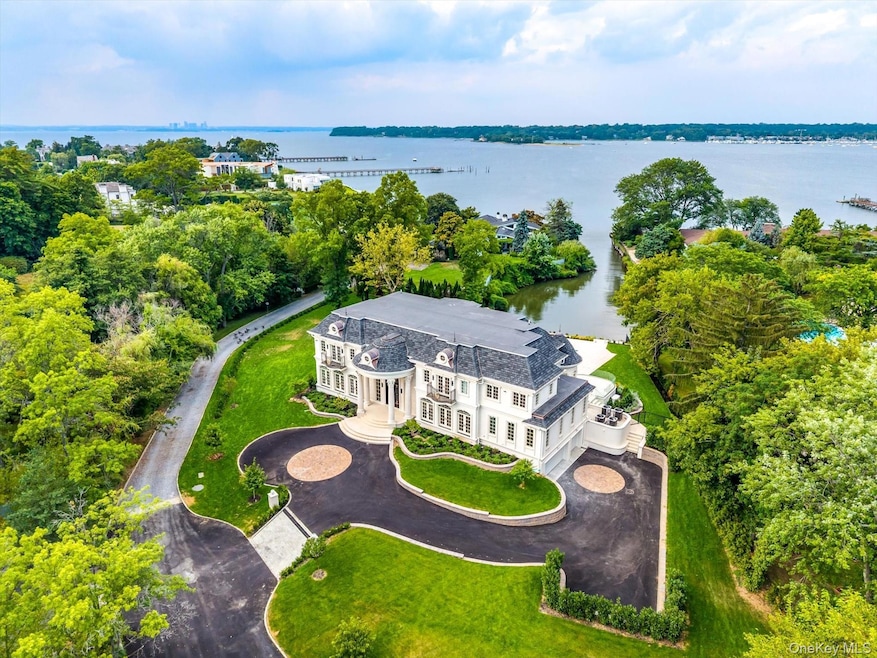
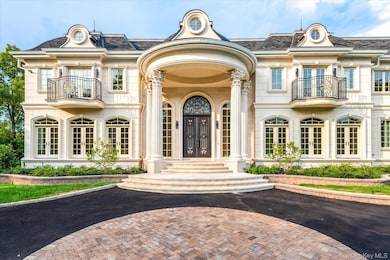
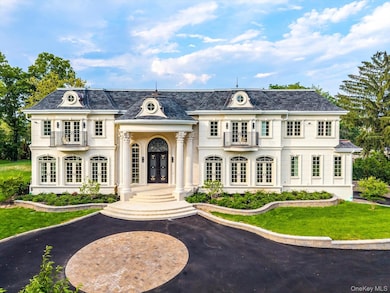
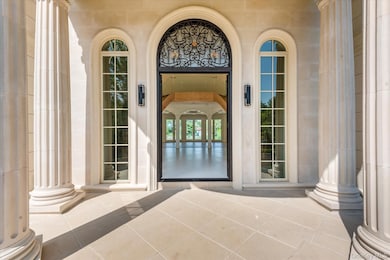
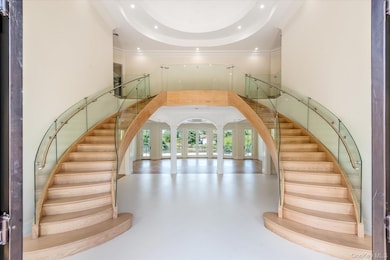
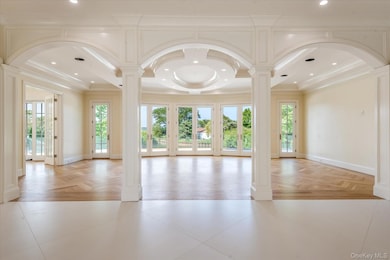
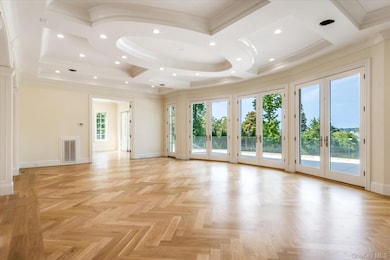
Experience unparalleled luxury and craftsmanship in this spectacular new construction nestled on over an acre of pristine waterview property in the heart of Kings Point. This one-of-a-kind custom-built estate spans approximately +/- 8,000 square feet of sophisticated living space, artfully designed for both grand entertaining and serene everyday living. From the moment you arrive, the home impresses with its timeless architectural design, extensive millwork, and impeccable finishes. Soaring ceilings and walls of glass flood the interior with natural light and frame breathtaking panoramic views of Manhasset Bay. Designed for effortless living, this stunning residence offers 6 spacious bedrooms and 5.5 designer bathrooms. The main floor boasts expansive formal living and dining rooms with direct water views, a large family room, Library and a state-of-the-art gourmet kitchen featuring top-of-the-line appliances, custom cabinetry, and a large center island perfect for entertaining. Wake up to peaceful water vistas in the luxurious primary suite, complete with a spa-like en-suite bath and generous closet space. Secondary bedrooms offer flexibility for guests, or office use, all thoughtfully laid out to maximize space and privacy. Set on a private lagoon with direct access to Manhasset Bay, this home is a kayaker’s paradise and an outdoor enthusiast’s dream. The beautifully landscaped grounds are an entertainer’s haven, featuring an oversized deck, in-ground swimming pool, and lush green space ideal for hosting gatherings or relaxing in your own private sanctuary.
Listing Agent
S Sharf Realty Inc Brokerage Phone: 516-773-6677 License #31SH0803063 Listed on: 11/18/2025
Co-Listing Agent
Edna Mashaal Realty LLC Brokerage Phone: 516-773-6677 License #49MA0955405
Home Details
Home Type
- Single Family
Year Built
- Built in 2025
Lot Details
- 1 Acre Lot
- Waterfront
- Landscaped
- Back Yard
Parking
- 3 Car Attached Garage
Home Design
- Colonial Architecture
- Frame Construction
Interior Spaces
- 8,000 Sq Ft Home
- Elevator
- Wired For Sound
- Tray Ceiling
- High Ceiling
- 1 Fireplace
- Entrance Foyer
- Formal Dining Room
- Storage
- Dryer
- Water Views
- Finished Basement
- Basement Fills Entire Space Under The House
Kitchen
- Eat-In Kitchen
- Gas Cooktop
- Dishwasher
- Wine Refrigerator
- Kitchen Island
Flooring
- Wood
- Radiant Floor
Bedrooms and Bathrooms
- 6 Bedrooms
- Main Floor Bedroom
- En-Suite Primary Bedroom
- Dual Closets
- Walk-In Closet
- Bathroom on Main Level
Pool
- In Ground Pool
- Outdoor Pool
Outdoor Features
- Patio
Schools
- John F Kennedy Elementary School
- Great Neck North Middle School
- Great Neck North High School
Utilities
- Forced Air Heating and Cooling System
- Natural Gas Connected
- Cesspool
Listing and Financial Details
- Assessor Parcel Number 2217-01-177-00-0053-0
Map
Home Values in the Area
Average Home Value in this Area
Tax History
| Year | Tax Paid | Tax Assessment Tax Assessment Total Assessment is a certain percentage of the fair market value that is determined by local assessors to be the total taxable value of land and additions on the property. | Land | Improvement |
|---|---|---|---|---|
| 2025 | $37,297 | $3,057 | $2,065 | $992 |
| 2024 | $3,579 | $1,343 | $1,343 | -- |
| 2023 | $19,648 | $1,343 | $1,343 | $0 |
| 2022 | $19,648 | $1,343 | $1,343 | $0 |
| 2021 | $19,625 | $2,340 | $1,343 | $997 |
| 2020 | $34,959 | $3,360 | $3,359 | $1 |
| 2019 | $33,097 | $3,600 | $3,599 | $1 |
| 2018 | $33,097 | $3,840 | $0 | $0 |
| 2017 | $38,326 | $5,940 | $3,908 | $2,032 |
| 2016 | $48,678 | $5,940 | $3,908 | $2,032 |
| 2015 | $9,866 | $5,742 | $4,372 | $1,370 |
| 2014 | $9,866 | $5,742 | $4,372 | $1,370 |
| 2013 | $9,415 | $5,742 | $4,372 | $1,370 |
Property History
| Date | Event | Price | List to Sale | Price per Sq Ft |
|---|---|---|---|---|
| 11/18/2025 11/18/25 | For Sale | $9,998,000 | -- | $1,250 / Sq Ft |
Purchase History
| Date | Type | Sale Price | Title Company |
|---|---|---|---|
| Bargain Sale Deed | $1,748,467 | Amtrust Title Insurance Co | |
| Bargain Sale Deed | $1,748,467 | Amtrust Title Insurance Co | |
| Bargain Sale Deed | $1,748,467 | Amtrust Title Insurance Co | |
| Bargain Sale Deed | $1,748,467 | Amtrust Title Insurance Co | |
| Bargain Sale Deed | $1,515,000 | Omni Title | |
| Bargain Sale Deed | $1,515,000 | Omni Title | |
| Bargain Sale Deed | $1,515,000 | Omni Title | |
| Bargain Sale Deed | $1,515,000 | Omni Title | |
| Deed | $3,600,000 | -- | |
| Deed | $3,600,000 | -- |
Source: OneKey® MLS
MLS Number: 936911
APN: 2217-01-177-00-0053-0
Disclaimer: Certain information contained herein is derived from information provided by parties other than Homes.com. All information provided is deemed reliable, but is not guaranteed to be accurate and should be independently verified.
![]() The data relating to real estate for sale or lease on this web site comes in part from OneKey® MLS. Real estate listings held by brokerage firms other than Ten-X are marked with the OneKey® MLS logo or an abbreviated logo and detailed information about them includes the name of the listing broker.
The data relating to real estate for sale or lease on this web site comes in part from OneKey® MLS. Real estate listings held by brokerage firms other than Ten-X are marked with the OneKey® MLS logo or an abbreviated logo and detailed information about them includes the name of the listing broker.
Based on information submitted to the MLS GRID. All data is obtained from various sources and may not have been verified by broker or MLS GRID. Supplied Open House Information is subject to change without notice. All information should be independently reviewed and verified for accuracy. Properties may or may not be listed by the office/agent presenting the information. Some IDX listings have been excluded from this website. IDX information is provided exclusively for personal, non-commercial use, and may not be used for any purpose other than to identify prospective properties consumers may be interested in purchasing.
Information is deemed reliable but not guaranteed.
Copyright 2026 OneKey® MLS. All rights reserved.
Based on information submitted to the MLS GRID
- 566 E Shore Rd
- 33 Harbour Rd
- 31 Harbour Rd
- 512 E Shore Rd
- 30 Wildwood Dr
- 32 Wildwood Dr
- 36 Pheasant Run
- 454 E Shore Rd
- 452 E Shore Rd
- 91, 92 & 93 Gatsby Ln
- 6B Blue Sea Ln
- 14 Farmers Rd
- 12 Red Brook Rd
- 21 Hayden Ave
- 7 Hayden Ave
- 40 Deer Park Rd
- 20 Henhawk Rd
- 13 Lighthouse Rd
- 227 Dock Ln
- 1 Franklin Rd
- 100 Hicks Ln
- 23 West Dr
- 11 Drury Ln
- 39 B S Norwood Rd Unit Right
- 37A Norwood Rd Unit Left Side
- 35 A S Norwood Rd Unit A
- 12 Forest Row Unit 1
- 20 Oldwood Rd
- 20 Oldwood Rd Unit 1st Floor
- 8 Dunes Ln Unit B- Second Floor
- 231 Manorhaven Blvd
- 219 Manorhaven Blvd Unit 1st Fl
- 3 Toms Point Ln Unit A
- 66 Essex Rd
- 24 Sintsink Dr W
- 15 Juniper Rd Unit 2nd Fl
- 165 Manorhaven Blvd Unit D
- 41 Mohegan Ave
- 523-531 Middle Neck Rd
- 10 Inwood Rd Unit B

Ask me questions while you tour the home.