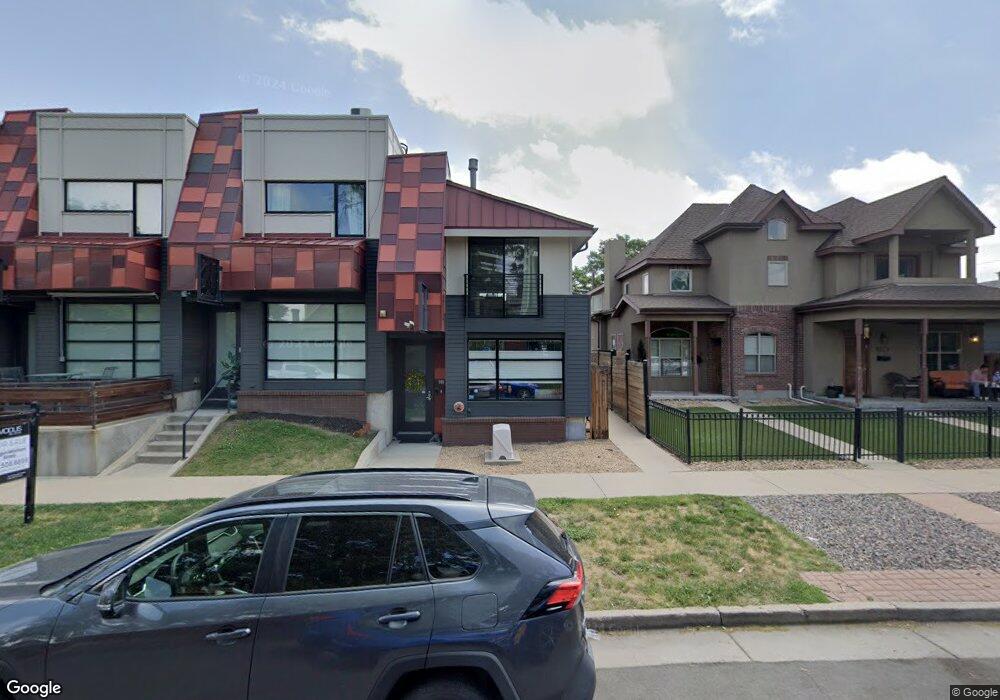
566 Inca St Denver, CO 80204
Baker NeighborhoodEstimated Value: $423,000 - $510,000
1
Bed
2
Baths
1,199
Sq Ft
$384/Sq Ft
Est. Value
About This Home
This home is located at 566 Inca St, Denver, CO 80204 and is currently estimated at $460,854, approximately $384 per square foot. 566 Inca St is a home located in Denver County with nearby schools including Kepner Beacon Middle School, West High School, and Girls Athletic Leadership School.
Ownership History
Date
Name
Owned For
Owner Type
Purchase Details
Closed on
Jun 30, 2021
Sold by
Gloriod Vivi B
Bought by
Keaveny Kathleen A and Hilzer Adam J
Current Estimated Value
Home Financials for this Owner
Home Financials are based on the most recent Mortgage that was taken out on this home.
Original Mortgage
$438,900
Outstanding Balance
$398,234
Interest Rate
2.9%
Mortgage Type
New Conventional
Estimated Equity
$62,620
Purchase Details
Closed on
Nov 24, 2014
Sold by
Secretary Of Housing & Urban Development
Bought by
Gloriod Vivi B
Purchase Details
Closed on
May 7, 2014
Sold by
Wells Fargo Bank Na
Bought by
Secretary Of Housing & Urban Development
Purchase Details
Closed on
May 5, 2014
Sold by
Thompson Jennifer I
Bought by
Wells Fargo Bank Na
Purchase Details
Closed on
Jul 18, 2008
Sold by
566 Inca Llc
Bought by
Thompson Jennifer I
Home Financials for this Owner
Home Financials are based on the most recent Mortgage that was taken out on this home.
Original Mortgage
$264,267
Interest Rate
6.4%
Mortgage Type
FHA
Create a Home Valuation Report for This Property
The Home Valuation Report is an in-depth analysis detailing your home's value as well as a comparison with similar homes in the area
Home Values in the Area
Average Home Value in this Area
Purchase History
| Date | Buyer | Sale Price | Title Company |
|---|---|---|---|
| Keaveny Kathleen A | $462,000 | Chicago Title | |
| Gloriod Vivi B | $260,000 | None Available | |
| Secretary Of Housing & Urban Development | -- | None Available | |
| Wells Fargo Bank Na | -- | None Available | |
| Thompson Jennifer I | $270,000 | Security Title |
Source: Public Records
Mortgage History
| Date | Status | Borrower | Loan Amount |
|---|---|---|---|
| Open | Keaveny Kathleen A | $438,900 | |
| Previous Owner | Thompson Jennifer I | $264,267 |
Source: Public Records
Tax History Compared to Growth
Tax History
| Year | Tax Paid | Tax Assessment Tax Assessment Total Assessment is a certain percentage of the fair market value that is determined by local assessors to be the total taxable value of land and additions on the property. | Land | Improvement |
|---|---|---|---|---|
| 2024 | $2,424 | $30,600 | $3,580 | $27,020 |
| 2023 | $2,371 | $30,600 | $3,580 | $27,020 |
| 2022 | $2,312 | $29,070 | $3,720 | $25,350 |
| 2021 | $2,312 | $29,910 | $3,830 | $26,080 |
| 2020 | $1,802 | $24,290 | $2,550 | $21,740 |
| 2019 | $1,752 | $24,290 | $2,550 | $21,740 |
| 2018 | $1,589 | $20,540 | $2,570 | $17,970 |
| 2017 | $1,584 | $20,540 | $2,570 | $17,970 |
| 2016 | $1,450 | $17,780 | $1,417 | $16,363 |
| 2015 | $1,389 | $17,780 | $1,417 | $16,363 |
| 2014 | $1,676 | $20,180 | $1,226 | $18,954 |
Source: Public Records
Map
Nearby Homes
- 475 Galapago St Unit 3
- 722 W 6th Ave
- 603 Inca St Unit 315
- 603 Inca St Unit 429
- 603 Inca St Unit 303
- 603 Inca St Unit 216
- 603 Inca St Unit 313
- 603 Inca St Unit 301
- 603 Inca St Unit 423
- 469 Elati St
- 664 Inca St
- 421 Elati St
- 351 Santa fe Dr
- 701 Galapago St
- 510 W 4th Ave
- 323 Inca St
- 314 Galapago St
- 321 Fox St
- 314 W 5th Ave
- 333 Delaware St