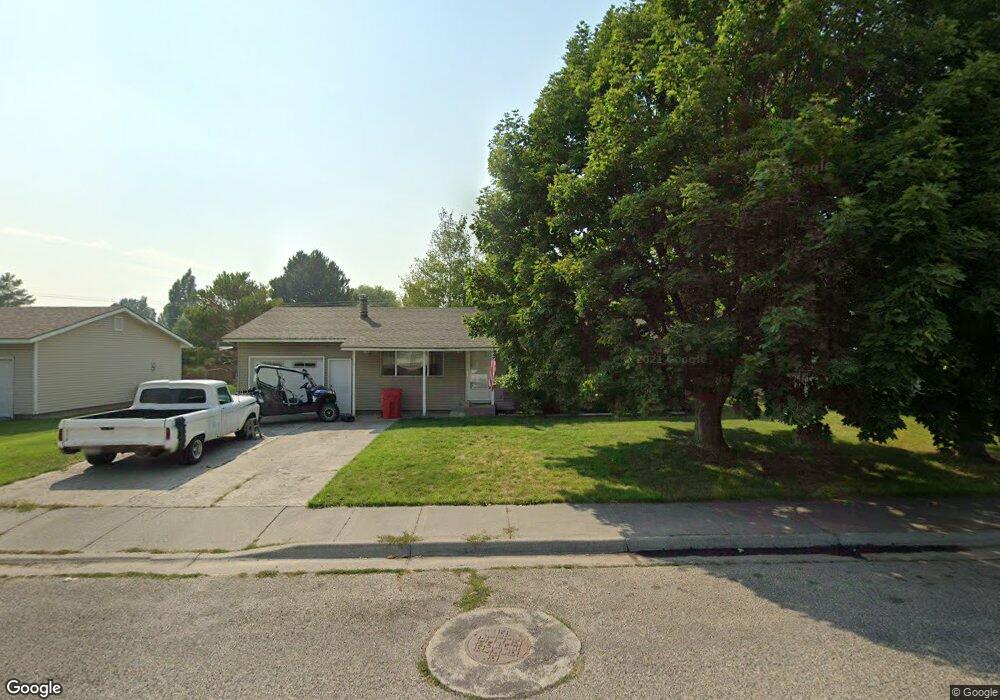
566 Maurine St Idaho Falls, ID 83401
Estimated Value: $293,000 - $306,000
3
Beds
1
Bath
1,040
Sq Ft
$287/Sq Ft
Est. Value
About This Home
This home is located at 566 Maurine St, Idaho Falls, ID 83401 and is currently estimated at $298,186, approximately $286 per square foot. 566 Maurine St is a home located in Bonneville County with nearby schools including Tiebreaker Elementary School, Sandcreek Middle School, and Hillcrest High School.
Ownership History
Date
Name
Owned For
Owner Type
Purchase Details
Closed on
Mar 25, 2021
Sold by
Christensen Tyson P and Christensen Mekenna
Bought by
Meikle Ted and Meikle Becky
Current Estimated Value
Purchase Details
Closed on
Feb 13, 2017
Sold by
Steel Spencer D and Steel Jenelle M
Bought by
Christensen Tyson P
Home Financials for this Owner
Home Financials are based on the most recent Mortgage that was taken out on this home.
Original Mortgage
$114,880
Interest Rate
3.75%
Mortgage Type
FHA
Purchase Details
Closed on
May 13, 2009
Sold by
Mcling Justin T and Mcling Jami L
Bought by
Steel Spencer D and Steel Jenelle M
Home Financials for this Owner
Home Financials are based on the most recent Mortgage that was taken out on this home.
Original Mortgage
$82,400
Interest Rate
4.71%
Mortgage Type
New Conventional
Purchase Details
Closed on
Dec 12, 2008
Sold by
Meling Justin and Meling Jaime
Bought by
Steel Spencer
Create a Home Valuation Report for This Property
The Home Valuation Report is an in-depth analysis detailing your home's value as well as a comparison with similar homes in the area
Home Values in the Area
Average Home Value in this Area
Purchase History
| Date | Buyer | Sale Price | Title Company |
|---|---|---|---|
| Meikle Ted | -- | Amerititle Idaho Falls | |
| Christensen Tyson P | -- | First American Title Idaho | |
| Steel Spencer D | -- | -- | |
| Steel Spencer | $163,000 | None Available |
Source: Public Records
Mortgage History
| Date | Status | Borrower | Loan Amount |
|---|---|---|---|
| Previous Owner | Christensen Tyson P | $114,880 | |
| Previous Owner | Steel Spencer D | $82,400 |
Source: Public Records
Tax History Compared to Growth
Tax History
| Year | Tax Paid | Tax Assessment Tax Assessment Total Assessment is a certain percentage of the fair market value that is determined by local assessors to be the total taxable value of land and additions on the property. | Land | Improvement |
|---|---|---|---|---|
| 2025 | $1,892 | $363,852 | $79,815 | $284,037 |
| 2024 | $1,892 | $389,392 | $77,979 | $311,413 |
| 2023 | $1,702 | $293,754 | $78,050 | $215,704 |
| 2022 | $1,647 | $243,470 | $54,866 | $188,604 |
| 2021 | $1,026 | $182,183 | $49,837 | $132,346 |
| 2019 | $957 | $157,193 | $43,299 | $113,894 |
| 2018 | $842 | $148,039 | $35,435 | $112,604 |
| 2017 | $779 | $125,646 | $21,267 | $104,379 |
| 2016 | $1,443 | $115,000 | $19,329 | $95,671 |
| 2015 | $1,336 | $106,619 | $19,329 | $87,290 |
| 2014 | $25,227 | $106,619 | $19,329 | $87,290 |
| 2013 | $1,266 | $102,078 | $19,329 | $82,749 |
Source: Public Records
Map
Nearby Homes
- TBD Amy Ln
- 370 Amy Ln
- 3648 Ellendale Cir
- 1038 Villa Vista Dr
- 967 Clara Ct
- 1067 Midway Ave
- 345 Luv Place
- 950 Clara Ct
- 167 S Heath Ln
- 470 Tie Breaker Dr
- 995 Edinburg Cir
- 3935 John Adams Pkwy
- 755 Tie Breaker Dr
- 3790 Briar Creek Cir
- 295 Crimson Dr
- 3818 Silverwood Cir
- 4177 Bracken Way
- 169 Robison Dr
- 298 Church St
- 388 Church St
- 566 Maurine Dr
- 544 Maurine Dr
- 544 Maurine St
- 588 Maurine St
- 543 Maurine St
- 500 Maurine St
- 567 Maurine St
- 521 Maurine Dr
- 521 Maurine St
- 605 Maurine St
- 622 Maurine St
- 622 Maurine Dr
- 500 Maurine Dr
- 3554 Jason Dr
- 558 Marjorie Ave
- 572 Marjorie Ave
- 522 Marjorie Ave
- 644 Maurine St
- 643 Maurine St
- 576 S Ammon Rd