Estimated Value: $216,000 - $239,000
3
Beds
2
Baths
1,506
Sq Ft
$151/Sq Ft
Est. Value
About This Home
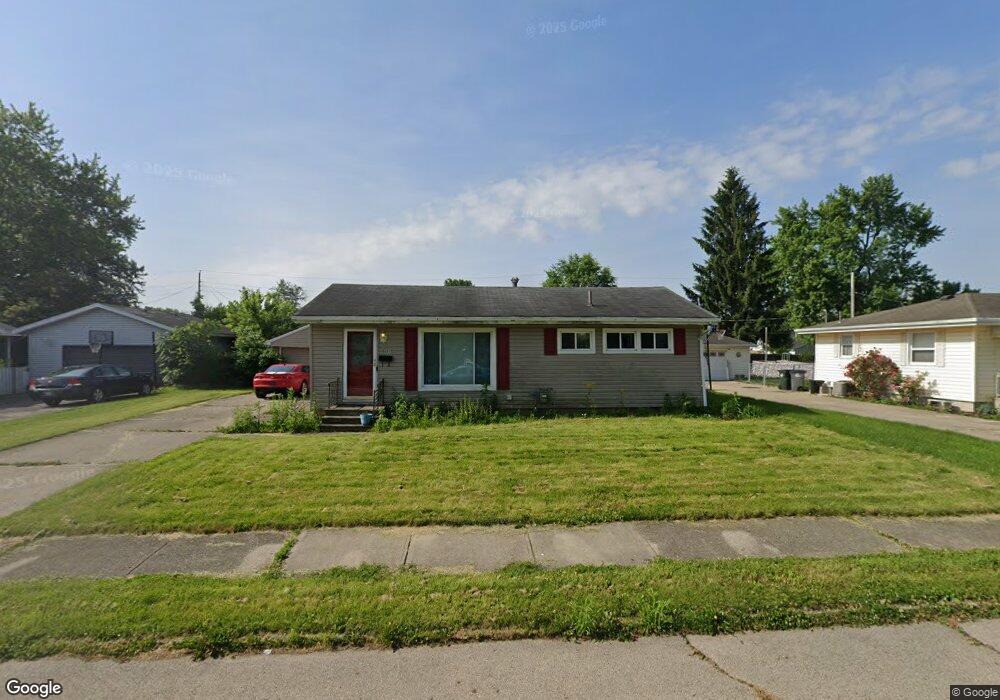
This home is located at 566 Miami St, Troy, OH 45373 and is currently estimated at $227,597, approximately $151 per square foot. 566 Miami St is a home located in Miami County with nearby schools including Cookson Elementary School, Troy Junior High School, and Van Cleve Elementary School.
Ownership History
Date
Name
Owned For
Owner Type
Purchase Details
Closed on
Jul 12, 2004
Sold by
Allen Christopher R and Allen Lori Ann
Bought by
Allen Christopher R and Allen Lori Ann
Current Estimated Value
Purchase Details
Closed on
Mar 26, 2002
Sold by
Adams Charles R and Adams Erin C
Bought by
Allen Christopher R
Home Financials for this Owner
Home Financials are based on the most recent Mortgage that was taken out on this home.
Original Mortgage
$112,604
Interest Rate
6.95%
Mortgage Type
FHA
Purchase Details
Closed on
Mar 6, 1995
Sold by
Buckland Lawrence O
Bought by
Buckland Lawrence O and Buckland Ellen M
Create a Home Valuation Report for This Property
The Home Valuation Report is an in-depth analysis detailing your home's value as well as a comparison with similar homes in the area
Home Values in the Area
Average Home Value in this Area
Purchase History
| Date | Buyer | Sale Price | Title Company |
|---|---|---|---|
| Allen Christopher R | -- | -- | |
| Allen Christopher R | $113,500 | -- | |
| Buckland Lawrence O | $92,000 | -- |
Source: Public Records
Mortgage History
| Date | Status | Borrower | Loan Amount |
|---|---|---|---|
| Previous Owner | Allen Christopher R | $112,604 | |
| Closed | Buckland Lawrence O | -- |
Source: Public Records
Tax History Compared to Growth
Tax History
| Year | Tax Paid | Tax Assessment Tax Assessment Total Assessment is a certain percentage of the fair market value that is determined by local assessors to be the total taxable value of land and additions on the property. | Land | Improvement |
|---|---|---|---|---|
| 2024 | $2,075 | $54,990 | $13,300 | $41,690 |
| 2023 | $2,075 | $54,990 | $13,300 | $41,690 |
| 2022 | $1,729 | $54,990 | $13,300 | $41,690 |
| 2021 | $1,399 | $42,280 | $10,220 | $32,060 |
| 2020 | $1,402 | $42,280 | $10,220 | $32,060 |
| 2019 | $1,414 | $42,280 | $10,220 | $32,060 |
| 2018 | $1,351 | $38,890 | $10,220 | $28,670 |
| 2017 | $1,365 | $38,890 | $10,220 | $28,670 |
| 2016 | $1,345 | $38,890 | $10,220 | $28,670 |
| 2015 | $1,298 | $35,980 | $9,450 | $26,530 |
| 2014 | $1,298 | $35,980 | $9,450 | $26,530 |
| 2013 | $1,307 | $35,980 | $9,450 | $26,530 |
Source: Public Records
Map
Nearby Homes
- 1075 Crestview Dr
- 708 N Market St
- 604 N Market St
- 1133 Lee Rd
- 1057 Stonyridge Ave
- 1206 Heritage Dr
- 1329 Lee Rd
- 199 Finsbury Ln
- 1597 Old Staunton Rd
- 755 W Bentley Cir
- 1160 Waterloo St
- 1164 Waterloo St
- 1188 E Bentley Cir
- 1137 Auburn St
- 813 W Bentley Cir
- 720 Sherwood Dr
- 839 Shaftsbury Rd
- 283 Riverside Dr
- 118 S Walnut St
- 996 Stony Brook Ln