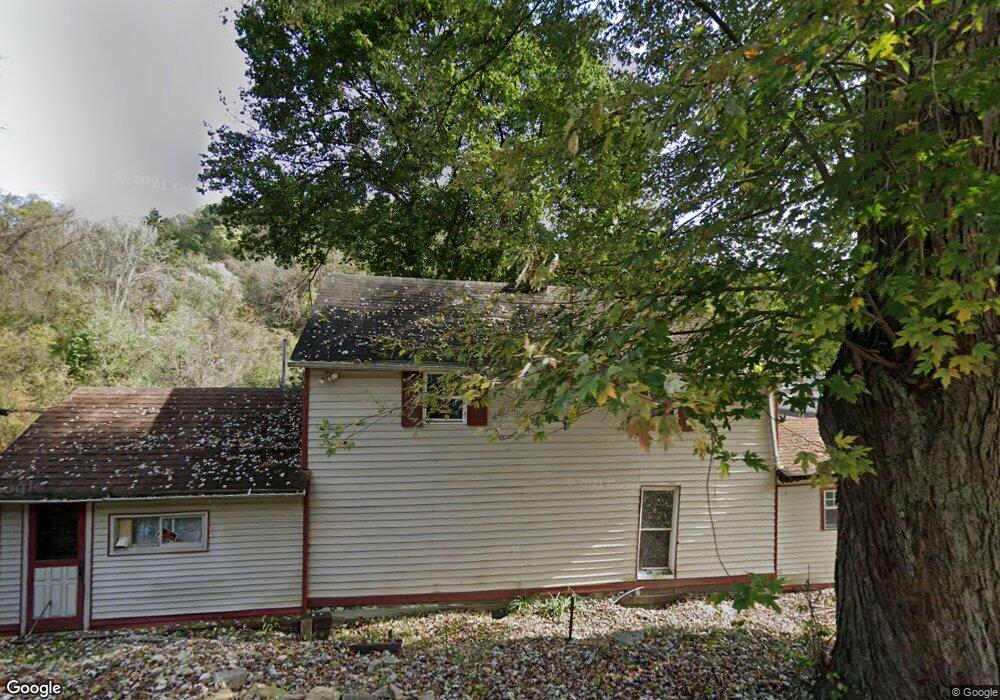
566 N 8th St Martins Ferry, OH 43935
Estimated Value: $47,000 - $82,000
2
Beds
1
Bath
768
Sq Ft
$84/Sq Ft
Est. Value
About This Home
This home is located at 566 N 8th St, Martins Ferry, OH 43935 and is currently estimated at $64,282, approximately $83 per square foot. 566 N 8th St is a home located in Belmont County with nearby schools including Anna Marie Ayers Elementary School, Martins Ferry Middle School, and Martins Ferry High School.
Ownership History
Date
Name
Owned For
Owner Type
Purchase Details
Closed on
Mar 3, 2016
Sold by
Gorney Christopher and Gorney Kayla
Bought by
Lucey Patrick and Tanner Alisha
Current Estimated Value
Purchase Details
Closed on
Mar 9, 2012
Sold by
Gorney Christopher and Gorney Kayla
Bought by
Lucey Patrick and Lucey Alisha
Home Financials for this Owner
Home Financials are based on the most recent Mortgage that was taken out on this home.
Original Mortgage
$25,000
Interest Rate
4%
Mortgage Type
Seller Take Back
Purchase Details
Closed on
Jun 18, 2010
Sold by
Bruney Gretchen
Bought by
Gorney Christopher and Cassidy Kayla
Purchase Details
Closed on
Jan 1, 1987
Sold by
Bruney Gretchen
Bought by
Bruney Gretchen
Create a Home Valuation Report for This Property
The Home Valuation Report is an in-depth analysis detailing your home's value as well as a comparison with similar homes in the area
Home Values in the Area
Average Home Value in this Area
Purchase History
| Date | Buyer | Sale Price | Title Company |
|---|---|---|---|
| Lucey Patrick | $25,000 | Attorney | |
| Lucey Patrick | $25,000 | None Available | |
| Gorney Christopher | $16,500 | Attorney | |
| Bruney Gretchen | -- | -- |
Source: Public Records
Mortgage History
| Date | Status | Borrower | Loan Amount |
|---|---|---|---|
| Previous Owner | Lucey Patrick | $25,000 |
Source: Public Records
Tax History Compared to Growth
Tax History
| Year | Tax Paid | Tax Assessment Tax Assessment Total Assessment is a certain percentage of the fair market value that is determined by local assessors to be the total taxable value of land and additions on the property. | Land | Improvement |
|---|---|---|---|---|
| 2024 | $952 | $16,720 | $1,960 | $14,760 |
| 2023 | $1,121 | $9,860 | $1,610 | $8,250 |
| 2022 | $1,170 | $9,856 | $1,610 | $8,246 |
| 2021 | $965 | $9,856 | $1,610 | $8,246 |
| 2020 | $1,356 | $8,580 | $1,400 | $7,180 |
| 2019 | $1,538 | $8,580 | $1,400 | $7,180 |
| 2018 | $1,716 | $8,580 | $1,400 | $7,180 |
| 2017 | $248 | $5,160 | $770 | $4,390 |
| 2016 | $563 | $5,090 | $700 | $4,390 |
| 2015 | $236 | $5,050 | $660 | $4,390 |
| 2014 | $303 | $6,450 | $600 | $5,850 |
| 2013 | $306 | $6,450 | $600 | $5,850 |
Source: Public Records
Map
Nearby Homes