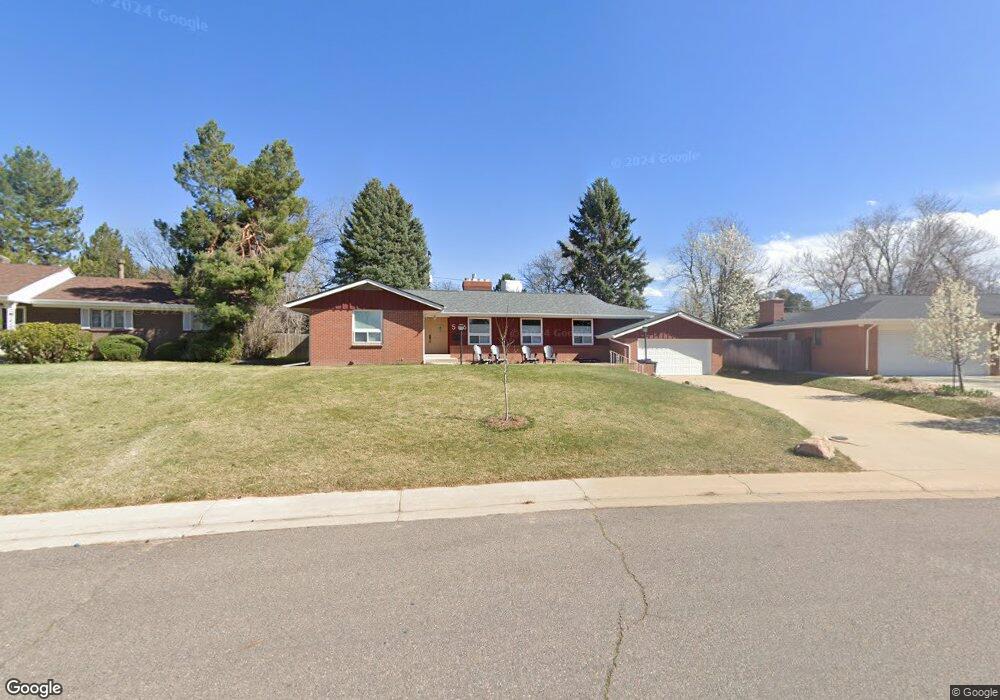
566 S Olive Way Denver, CO 80224
Washington Virginia Vale NeighborhoodEstimated Value: $793,692 - $864,000
3
Beds
3
Baths
2,151
Sq Ft
$384/Sq Ft
Est. Value
About This Home
This home is located at 566 S Olive Way, Denver, CO 80224 and is currently estimated at $826,673, approximately $384 per square foot. 566 S Olive Way is a home located in Denver County with nearby schools including Denver Green School, George Washington High School, and Stanley British Primary School.
Ownership History
Date
Name
Owned For
Owner Type
Purchase Details
Closed on
May 10, 2021
Sold by
Brodie Beverly Geyer and The Rovene D Geyer Survivors T
Bought by
Copeland Rachel D
Current Estimated Value
Home Financials for this Owner
Home Financials are based on the most recent Mortgage that was taken out on this home.
Original Mortgage
$597,550
Outstanding Balance
$541,530
Interest Rate
3.1%
Mortgage Type
New Conventional
Estimated Equity
$285,143
Purchase Details
Closed on
Feb 21, 2020
Sold by
Geyer Rovene D and Brodie Beverly
Bought by
Rovene D Geyer Survivor S Trust
Purchase Details
Closed on
Jun 10, 2009
Sold by
Geyer Rovene D and Brodie Beverly
Bought by
Herbert S Geyer Marital Trust
Purchase Details
Closed on
Nov 24, 2008
Sold by
Brodie Steven Kevin and Geyer Rachel Anne
Bought by
The Geyer Family Living Trust
Purchase Details
Closed on
Dec 1, 2000
Sold by
Geyer Herbert
Bought by
The Geyer Family Estate Trust
Purchase Details
Closed on
May 16, 1997
Sold by
Geyer Herbert & Rovene Trust
Bought by
Geyer Herbert S and Geyer Rovene D
Create a Home Valuation Report for This Property
The Home Valuation Report is an in-depth analysis detailing your home's value as well as a comparison with similar homes in the area
Home Values in the Area
Average Home Value in this Area
Purchase History
| Date | Buyer | Sale Price | Title Company |
|---|---|---|---|
| Copeland Rachel D | $703,000 | Shore To Close Title Agency | |
| Rovene D Geyer Survivor S Trust | -- | None Available | |
| Herbert S Geyer Marital Trust | -- | None Available | |
| The Geyer Family Living Trust | -- | None Available | |
| The Geyer Family Estate Trust | -- | -- | |
| Geyer Herbert S | -- | -- |
Source: Public Records
Mortgage History
| Date | Status | Borrower | Loan Amount |
|---|---|---|---|
| Open | Copeland Rachel D | $597,550 |
Source: Public Records
Tax History Compared to Growth
Tax History
| Year | Tax Paid | Tax Assessment Tax Assessment Total Assessment is a certain percentage of the fair market value that is determined by local assessors to be the total taxable value of land and additions on the property. | Land | Improvement |
|---|---|---|---|---|
| 2024 | $3,942 | $49,770 | $34,740 | $15,030 |
| 2023 | $3,856 | $49,770 | $34,740 | $15,030 |
| 2022 | $3,255 | $40,930 | $39,860 | $1,070 |
| 2021 | $3,255 | $42,110 | $41,010 | $1,100 |
| 2020 | $2,418 | $39,740 | $20,510 | $19,230 |
| 2019 | $2,350 | $39,740 | $20,510 | $19,230 |
| 2018 | $2,246 | $36,230 | $20,650 | $15,580 |
| 2017 | $2,239 | $36,230 | $20,650 | $15,580 |
| 2016 | $2,274 | $35,850 | $16,437 | $19,413 |
| 2015 | $2,179 | $35,850 | $16,437 | $19,413 |
| 2014 | $1,719 | $28,660 | $12,370 | $16,290 |
Source: Public Records
Map
Nearby Homes
- 507 S Pontiac Way
- 7055 E Virginia Ave
- 434 S Newport Way
- 435 S Olive Way
- 7155 E Exposition Ave
- 404 S Oneida Way
- 703 S Oneida Way
- 6685 E Exposition Ave
- 6601 E Exposition Ave
- 6524 E Alaska Dr
- 222 S Olive St
- 441 S Monaco Pkwy
- 875 S Quebec St Unit 15
- 875 S Quebec St Unit 24
- 488 S Leyden St
- 308 S Locust St
- 778 S Leyden St
- 786 S Leyden St
- 405 S Krameria St
- 360 S Krameria St
- 556 S Olive Way
- 576 S Olive Way
- 617 S Pontiac Way
- 607 S Pontiac Way
- 637 S Pontiac Way
- 586 S Olive Way
- 546 S Olive Way
- 575 S Olive Way
- 565 S Olive Way
- 657 S Pontiac Way
- 577 S Pontiac Way
- 584 S Oneida Way
- 667 S Pontiac Way
- 596 S Olive Way
- 545 S Olive Way
- 557 S Pontiac Way
- 536 S Olive Way
- 564 S Oneida Way
- 618 S Pontiac Way
- 608 S Pontiac Way