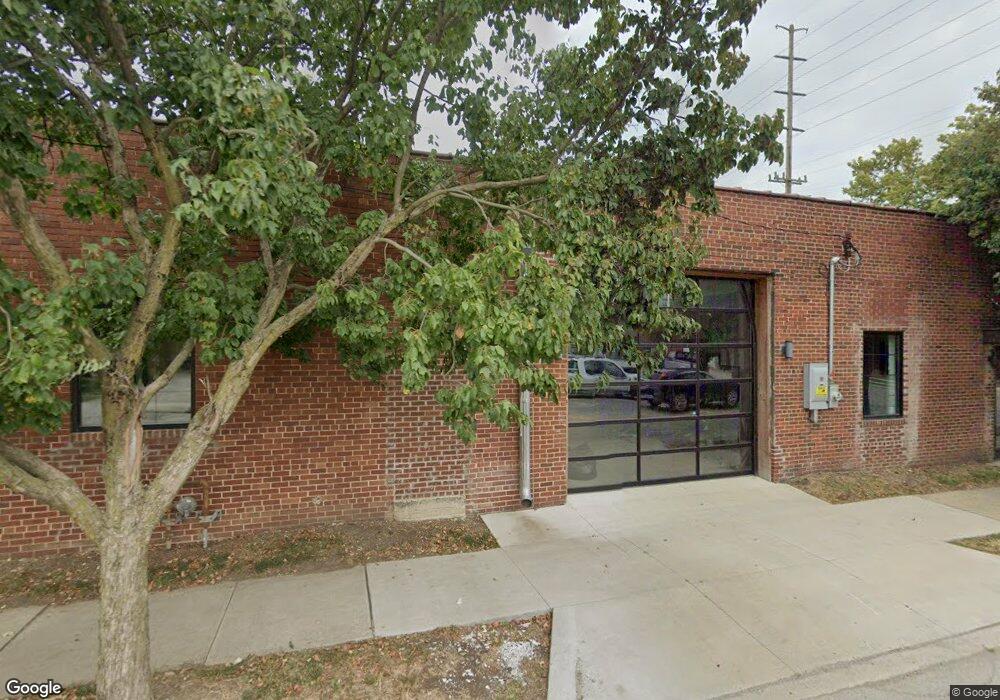
566 W Rich St Columbus, OH 43215
East Franklinton NeighborhoodEstimated Value: $727,161
--
Bed
--
Bath
8,236
Sq Ft
$88/Sq Ft
Est. Value
About This Home
This home is located at 566 W Rich St, Columbus, OH 43215 and is currently priced at $727,161, approximately $88 per square foot. 566 W Rich St is a home located in Franklin County with nearby schools including Starling PK-8, Sullivant Elementary School, and West High School.
Ownership History
Date
Name
Owned For
Owner Type
Purchase Details
Closed on
Feb 28, 2024
Sold by
Wilber Enterprises Llc
Bought by
Pilot Dogs Inc
Current Estimated Value
Purchase Details
Closed on
Feb 15, 2024
Sold by
Wilber Enterprises Llc
Bought by
Pilot Dogs Inc
Purchase Details
Closed on
Jun 22, 2021
Sold by
566 West Rich Street Llc
Bought by
Wilber Enterprises Llc
Home Financials for this Owner
Home Financials are based on the most recent Mortgage that was taken out on this home.
Original Mortgage
$500,000
Interest Rate
2.9%
Mortgage Type
Future Advance Clause Open End Mortgage
Purchase Details
Closed on
Apr 29, 2016
Sold by
Guiler G Scott
Bought by
566 West Rich St Llc
Purchase Details
Closed on
Sep 3, 2003
Sold by
Gutheil Henson Sally and Gutheil Richard Alwin
Bought by
Guiler G Scott
Purchase Details
Closed on
Jan 25, 1983
Bought by
Gutheil Betty C
Create a Home Valuation Report for This Property
The Home Valuation Report is an in-depth analysis detailing your home's value as well as a comparison with similar homes in the area
Home Values in the Area
Average Home Value in this Area
Purchase History
| Date | Buyer | Sale Price | Title Company |
|---|---|---|---|
| Pilot Dogs Inc | $1,700,000 | Associates Title | |
| Pilot Dogs Inc | $1,700,000 | Associates Title | |
| Wilber Enterprises Llc | $625,000 | Fidelity Natl Ttl Westrville | |
| 566 West Rich St Llc | -- | None Available | |
| Guiler G Scott | $89,500 | Amerititle Agency Inc | |
| Gutheil Betty C | -- | -- |
Source: Public Records
Mortgage History
| Date | Status | Borrower | Loan Amount |
|---|---|---|---|
| Previous Owner | Wilber Enterprises Llc | $500,000 |
Source: Public Records
Tax History Compared to Growth
Tax History
| Year | Tax Paid | Tax Assessment Tax Assessment Total Assessment is a certain percentage of the fair market value that is determined by local assessors to be the total taxable value of land and additions on the property. | Land | Improvement |
|---|---|---|---|---|
| 2024 | $3,489 | $44,980 | $8,230 | $36,750 |
| 2023 | $3,601 | $44,975 | $8,225 | $36,750 |
| 2022 | $4,695 | $39,730 | $7,420 | $32,310 |
| 2021 | $3,139 | $39,730 | $7,420 | $32,310 |
| 2020 | $3,118 | $39,730 | $7,420 | $32,310 |
| 2019 | $2,846 | $34,550 | $6,440 | $28,110 |
| 2018 | $1,149 | $28,000 | $6,440 | $21,560 |
| 2017 | $2,303 | $28,000 | $6,440 | $21,560 |
| 2016 | $2,741 | $31,500 | $6,440 | $25,060 |
| 2015 | $1,310 | $31,500 | $6,440 | $25,060 |
| 2014 | $2,544 | $31,500 | $6,440 | $25,060 |
| 2013 | $1,261 | $31,500 | $6,440 | $25,060 |
Source: Public Records
Map
Nearby Homes
- 601 W Rich St Unit 601
- 609 W Rich St Unit 609
- 245 S Skidmore St
- 251 S Skidmore St Unit 251
- 546 W Town St
- 538 W Town St
- 550 W Town St
- 536 W Town St
- 502 W Town St
- 273 S Grubb St Unit 273
- 642 W State St
- 763 W Rich St
- 772 Sullivant Ave Unit 772
- 765 Campbell Ave
- 839 W Rich St
- 760 Thomas Ave
- 791 Campbell Ave
- 870-872 Sullivant Ave
- 45 N Hartford Ave
- 49 S Hartford Ave
- 201 S Gift St
- 554 W Rich St
- 196 S Gift St
- 581 W Rich St
- 186 S Gift St
- 567 W Town St
- 544 W Walnut St
- 532 W Rich St
- 540 W Walnut St
- 242 S Skidmore St Unit 244
- 551 W Town St
- 536 W Walnut St
- 246 S Skidmore St
- 532 W Walnut St
- 255 S Gift St
- 250 S Skidmore St
- 530 W Walnut St
- 254 S Skidmore St
- 257 S Gift St
- 258 S Skidmore St