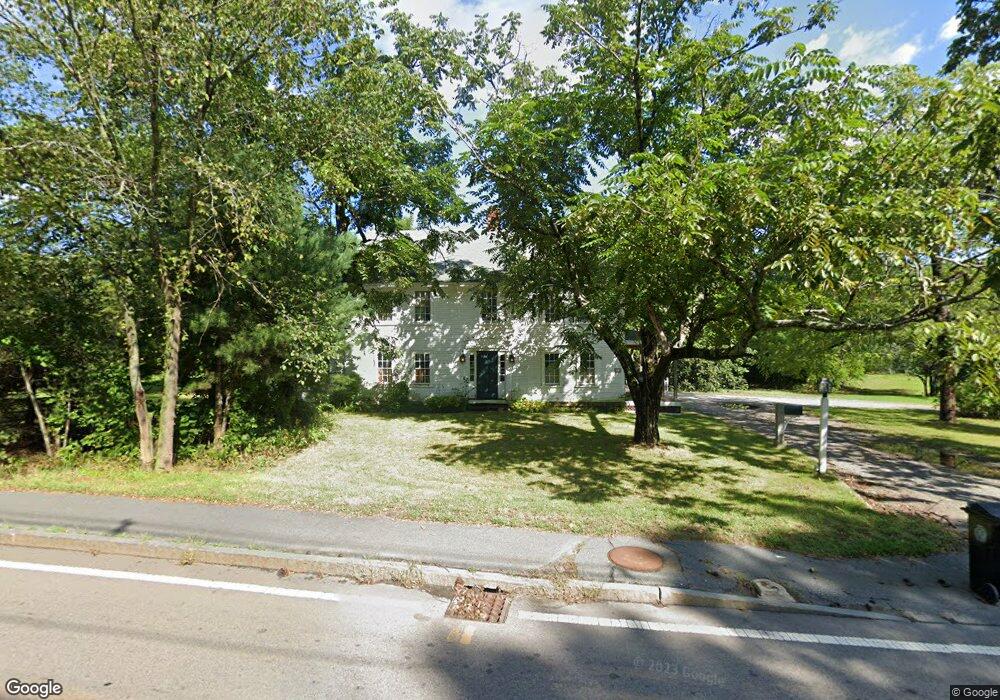
566 West St Wrentham, MA 02093
Sheldonville NeighborhoodEstimated Value: $711,719 - $754,000
3
Beds
2
Baths
2,854
Sq Ft
$257/Sq Ft
Est. Value
About This Home
This home is located at 566 West St, Wrentham, MA 02093 and is currently estimated at $734,680, approximately $257 per square foot. 566 West St is a home located in Norfolk County with nearby schools including Delaney Elementary School, Charles E Roderick, and Mercymount Country Day School.
Ownership History
Date
Name
Owned For
Owner Type
Purchase Details
Closed on
Dec 28, 1994
Sold by
Dedham Coop Bank
Bought by
Kebler William A and Kebler Rebecca J
Current Estimated Value
Home Financials for this Owner
Home Financials are based on the most recent Mortgage that was taken out on this home.
Original Mortgage
$115,000
Interest Rate
9.2%
Mortgage Type
Purchase Money Mortgage
Purchase Details
Closed on
Dec 2, 1993
Sold by
Roxwell Stephen F
Bought by
Dedham Coop Bk
Purchase Details
Closed on
Jul 14, 1989
Sold by
Boudreau Richard A
Bought by
Foxwell Stephen F
Home Financials for this Owner
Home Financials are based on the most recent Mortgage that was taken out on this home.
Original Mortgage
$280,000
Interest Rate
10.39%
Mortgage Type
Purchase Money Mortgage
Create a Home Valuation Report for This Property
The Home Valuation Report is an in-depth analysis detailing your home's value as well as a comparison with similar homes in the area
Home Values in the Area
Average Home Value in this Area
Purchase History
| Date | Buyer | Sale Price | Title Company |
|---|---|---|---|
| Kebler William A | $110,000 | -- | |
| Dedham Coop Bk | $255,000 | -- | |
| Foxwell Stephen F | $375,000 | -- |
Source: Public Records
Mortgage History
| Date | Status | Borrower | Loan Amount |
|---|---|---|---|
| Open | Foxwell Stephen F | $155,000 | |
| Closed | Foxwell Stephen F | $115,000 | |
| Previous Owner | Foxwell Stephen F | $280,000 |
Source: Public Records
Tax History Compared to Growth
Tax History
| Year | Tax Paid | Tax Assessment Tax Assessment Total Assessment is a certain percentage of the fair market value that is determined by local assessors to be the total taxable value of land and additions on the property. | Land | Improvement |
|---|---|---|---|---|
| 2025 | $6,242 | $538,600 | $288,600 | $250,000 |
| 2024 | $6,854 | $571,200 | $288,600 | $282,600 |
| 2023 | $5,943 | $470,900 | $262,500 | $208,400 |
| 2022 | $6,570 | $480,600 | $255,700 | $224,900 |
| 2021 | $6,412 | $455,700 | $239,000 | $216,700 |
| 2020 | $5,663 | $397,400 | $182,600 | $214,800 |
| 2019 | $5,354 | $379,200 | $164,400 | $214,800 |
| 2018 | $6,140 | $431,200 | $164,200 | $267,000 |
| 2017 | $5,758 | $404,100 | $161,000 | $243,100 |
| 2016 | $5,681 | $397,800 | $156,400 | $241,400 |
| 2015 | $5,719 | $381,800 | $167,000 | $214,800 |
| 2014 | $5,629 | $367,700 | $160,600 | $207,100 |
Source: Public Records
Map
Nearby Homes
- 50 Green St
- 80 Carriage House Ln
- 440 Chestnut St
- 955 Summer St
- 1204 South St
- 1222 South St
- 19 Chestnut Lot 0
- 11 Amber Dr
- 791 South St Unit 5
- 4 Munroe Dr
- 12 Grant St
- 6 Woodchester Rd
- Lot 1 - Blueberry 2 Car Plan at King Philip Estates
- Lot 8 - Blueberry 2 Car Plan at King Philip Estates
- Lot 5 - Hughes 2 car Plan at King Philip Estates
- Lot 6 - Blueberry 3 Car Plan at King Philip Estates
- Lot 2 - Camden 2 Car Plan at King Philip Estates
- Lot 7 - Cedar Plan at King Philip Estates
- Lot 4 - Hemingway 2 Car Plan at King Philip Estates
- Lot 3 - Blueberry 2 Car Plan at King Philip Estates