Estimated Value: $306,000 - $333,000
About This Home
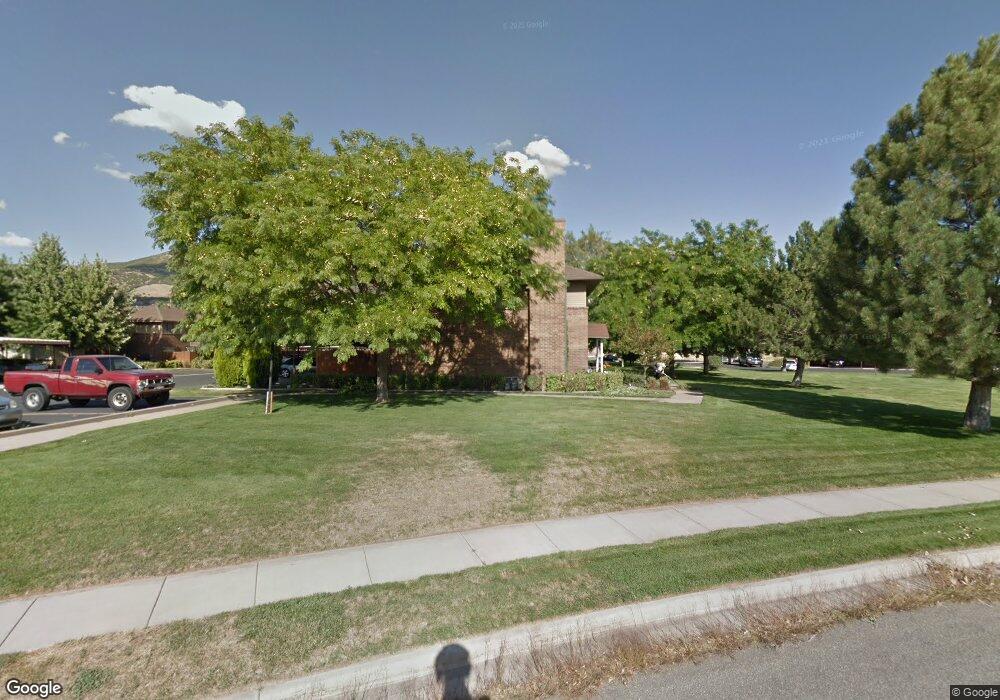
This home is located at 5660 S 1425 E Unit 3C, Ogden, UT 84403 and is currently estimated at $319,341, approximately $190 per square foot. 5660 S 1425 E Unit 3C is a home located in Weber County with nearby schools including Uintah School, South Ogden Junior High School, and Bonneville High School.
Ownership History
We collect this data history from publicly available records. To have your information removed, we recommend requesting removal directly through your county’s website.
Purchase Details
Purchase Details
Home Financials for this Owner
Home Financials are based on the most recent Mortgage that was taken out on this home.Purchase Details
Home Financials for this Owner
Home Financials are based on the most recent Mortgage that was taken out on this home.Home Values in the Area
Average Home Value in this Area
Purchase History
We collect this data history from publicly available records. To have your information removed, we recommend requesting removal directly through your county’s website.
| Date | Buyer | Sale Price | Title Company |
|---|---|---|---|
| -- | Mountain View Title | ||
| -- | American Dream Title Ins Age | ||
| -- | Equity Title |
Mortgage History
We collect this data history from publicly available records. To have your information removed, we recommend requesting removal directly through your county’s website.
| Date | Status | Borrower | Loan Amount |
|---|---|---|---|
| Previous Owner | $135,867 | ||
| Previous Owner | $100,700 |
Tax History
We collect this data history from publicly available records. To have your information removed, we recommend requesting removal directly through your county’s website.
| Year | Tax Paid | Tax Assessment Tax Assessment Total Assessment is a certain percentage of the fair market value that is determined by local assessors to be the total taxable value of land and additions on the property. | Land | Improvement |
|---|---|---|---|---|
| 2025 | $2,076 | $318,225 | $75,000 | $243,225 |
| 2024 | $1,979 | $170,500 | $41,250 | $129,250 |
| 2023 | $1,850 | $159,500 | $41,250 | $118,250 |
| 2022 | $1,815 | $160,050 | $41,250 | $118,800 |
| 2021 | $1,459 | $217,000 | $40,000 | $177,000 |
| 2020 | $1,305 | $181,000 | $30,000 | $151,000 |
| 2019 | $1,356 | $181,000 | $22,000 | $159,000 |
| 2018 | $1,226 | $155,000 | $22,000 | $133,000 |
| 2017 | $1,072 | $131,000 | $22,000 | $109,000 |
| 2016 | $912 | $62,700 | $11,000 | $51,700 |
| 2015 | $927 | $62,700 | $11,000 | $51,700 |
| 2014 | $784 | $52,250 | $11,000 | $41,250 |
Map
- 5659 Fox Chase Dr
- 1395 E 5600 S
- 5619 S Fox Chase Dr E
- 1750 E 5625 S Unit B
- 1371 E 5800 S
- 1365 E 5800 S
- 1425 E 5850 S Unit 4E
- 1821 E 5650 S
- 1842 E 5625 S Unit C
- 1081 E 5675 S
- 5630 Meadow Ln Unit 172
- 5630 Meadow Ln Unit 192
- 5660 S Meadow Ln Unit 140
- 5600 Meadow Ln Unit 144
- 1671 Cherokee Cir
- 1068 E 5675 S
- 1856 E 5775 S
- 1205 E 5275 S Unit 34
- 5505 S 1025 E
- 1143 E 5275 S Unit 33
- 5660 S 1425 E Unit 3F
- 5660 S 1425 E Unit 3E
- 5660 S 1425 E Unit 3D
- 5660 S 1425 E Unit 3B
- 5660 S 1425 E Unit 3A
- 5660 S 1425 E Unit 2B
- 5660 S 1425 E
- 5670 S 1425 E Unit 4
- 5670 S 1425 E Unit 4E
- 5670 S 1425 E Unit 4D
- 5670 S 1425 E Unit 4C
- 5670 S 1425 E Unit 4B
- 5670 S 1425 E Unit 4A
- 5670 S 1425 E
- 5670 S 1425 E Unit B
- 5650 S 1425 E Unit 2F
- 5650 S 1425 E Unit 2E
- 5650 S 1425 E Unit 2D
- 5650 S 1425 E Unit 2C
- 5650 S 1425 E Unit 2B
Ask me questions while you tour the home.