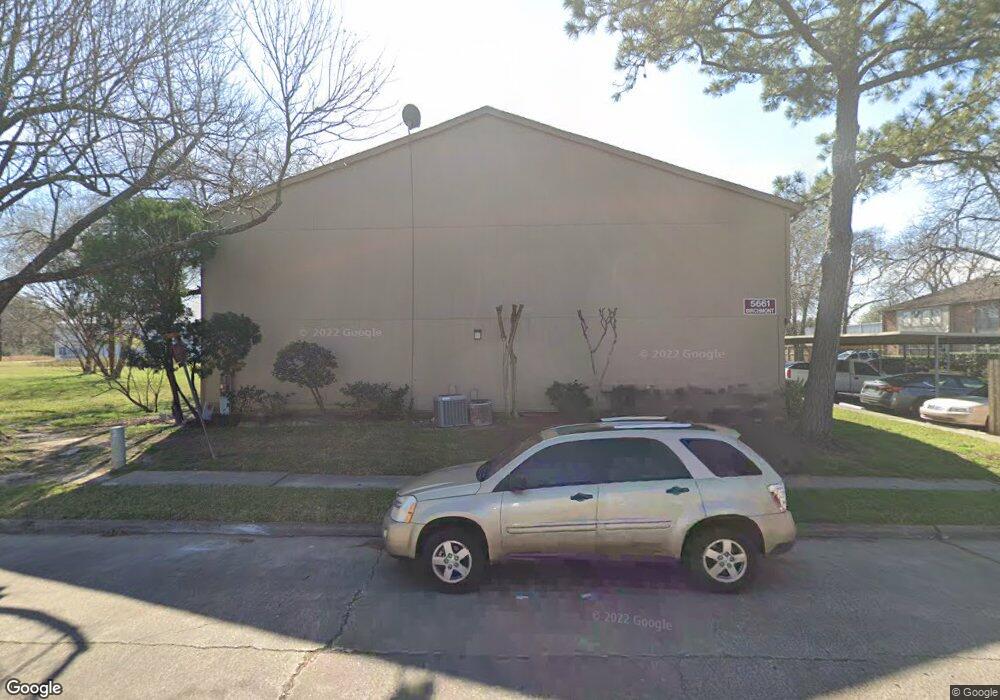
5661 Birchmont Dr Unit 5 Houston, TX 77091
Oak Forest-Garden Oaks NeighborhoodEstimated Value: $80,000 - $121,000
2
Beds
2
Baths
1,276
Sq Ft
$83/Sq Ft
Est. Value
About This Home
This home is located at 5661 Birchmont Dr Unit 5, Houston, TX 77091 and is currently estimated at $105,835, approximately $82 per square foot. 5661 Birchmont Dr Unit 5 is a home located in Harris County with nearby schools including Clifton Middle, Scarborough High School, and Southwest Schools Mangum El Campus.
Ownership History
Date
Name
Owned For
Owner Type
Purchase Details
Closed on
Jun 29, 2015
Sold by
Xtd Investments Llc
Bought by
Lopez Jose A and Maldonado Edna
Current Estimated Value
Purchase Details
Closed on
Jun 26, 2015
Sold by
Ovation Tax Lien Fund Lp
Bought by
Xtd Investments Llc
Purchase Details
Closed on
Mar 3, 2015
Sold by
Carter Christina R
Bought by
Fgms Holdings Llc
Purchase Details
Closed on
Aug 8, 2008
Sold by
Visbal Michael
Bought by
Cartet Christina R
Purchase Details
Closed on
Jul 28, 2005
Sold by
Nunez Juvenal L
Bought by
Visbal Michael
Purchase Details
Closed on
Jun 28, 1995
Sold by
First Baptist Church Of Houston
Bought by
Hoffman Ray and Hoffman Gabriela
Home Financials for this Owner
Home Financials are based on the most recent Mortgage that was taken out on this home.
Original Mortgage
$21,344
Interest Rate
7.79%
Mortgage Type
Seller Take Back
Create a Home Valuation Report for This Property
The Home Valuation Report is an in-depth analysis detailing your home's value as well as a comparison with similar homes in the area
Home Values in the Area
Average Home Value in this Area
Purchase History
| Date | Buyer | Sale Price | Title Company |
|---|---|---|---|
| Lopez Jose A | -- | None Available | |
| Xtd Investments Llc | -- | None Available | |
| Fgms Holdings Llc | $14,476 | None Available | |
| Cartet Christina R | -- | None Available | |
| Visbal Michael | -- | First American Title | |
| Hoffman Ray | -- | -- |
Source: Public Records
Mortgage History
| Date | Status | Borrower | Loan Amount |
|---|---|---|---|
| Previous Owner | Hoffman Ray | $21,344 |
Source: Public Records
Tax History Compared to Growth
Tax History
| Year | Tax Paid | Tax Assessment Tax Assessment Total Assessment is a certain percentage of the fair market value that is determined by local assessors to be the total taxable value of land and additions on the property. | Land | Improvement |
|---|---|---|---|---|
| 2025 | $1,056 | $122,915 | $23,354 | $99,561 |
| 2024 | $1,056 | $104,558 | $19,866 | $84,692 |
| 2023 | $1,056 | $104,558 | $19,866 | $84,692 |
| 2022 | $1,530 | $89,388 | $16,984 | $72,404 |
| 2021 | $1,467 | $69,786 | $13,259 | $56,527 |
| 2020 | $1,383 | $69,786 | $13,259 | $56,527 |
| 2019 | $1,307 | $67,612 | $12,846 | $54,766 |
| 2018 | $868 | $44,634 | $8,480 | $36,154 |
| 2017 | $1,188 | $44,634 | $8,480 | $36,154 |
| 2016 | $1,188 | $44,634 | $8,480 | $36,154 |
| 2015 | $924 | $44,634 | $8,480 | $36,154 |
| 2014 | $924 | $34,180 | $6,494 | $27,686 |
Source: Public Records
Map
Nearby Homes
- 5606 Creekmont Dr
- 5667 Birchmont Dr Unit H
- 5667 Birchmont Dr Unit A
- 3716 Creekmont Gardens Ln
- 5662 Birchmont Dr Unit A
- 5670 Birchmont Dr Unit C
- 5451 Oakhaven Ln
- 5414 Deep Forest Dr
- 5116 Creekmont Dr
- 5114 Golden Forest Dr Unit B
- 4934 Pinemont Dr
- 5036 Golden Forest Dr
- 5036 Creekmont Dr
- 5511 Oak Trail Ln
- 5807 Silver Forest Dr
- 5029 Broom St Unit A
- 5029 Broom St Unit C
- 5029 Broom St Unit B
- 5826 Spruce Forest Dr
- 5018 Golden Forest Dr
- 5661 Birchmont Dr Unit 5
- 5661 Birchmont Dr Unit 5
- 5661 Birchmont Dr Unit 5
- 5661 Birchmont Dr Unit 5
- 5661 Birchmont Dr Unit 5
- 5661 Birchmont Dr Unit 5
- 5661 Birchmont Dr Unit 5
- 5661 Birchmont Dr Unit B
- 5661 Birchmont Dr Unit D
- 5663 Birchmont Dr Unit 4
- 5663 Birchmont Dr Unit 4
- 5663 Birchmont Dr Unit 4
- 5663 Birchmont Dr Unit 4
- 5663 Birchmont Dr Unit 4
- 5663 Birchmont Dr Unit 4
- 5663 Birchmont Dr Unit 4
- 5663 Birchmont Dr Unit 4
- 5663 Birchmont Dr Unit D
- 5663 Birchmont Dr Unit C
- 5663 Birchmont Dr Unit G