Estimated Value: $348,000 - $551,000
3
Beds
2
Baths
1,460
Sq Ft
$322/Sq Ft
Est. Value
About This Home
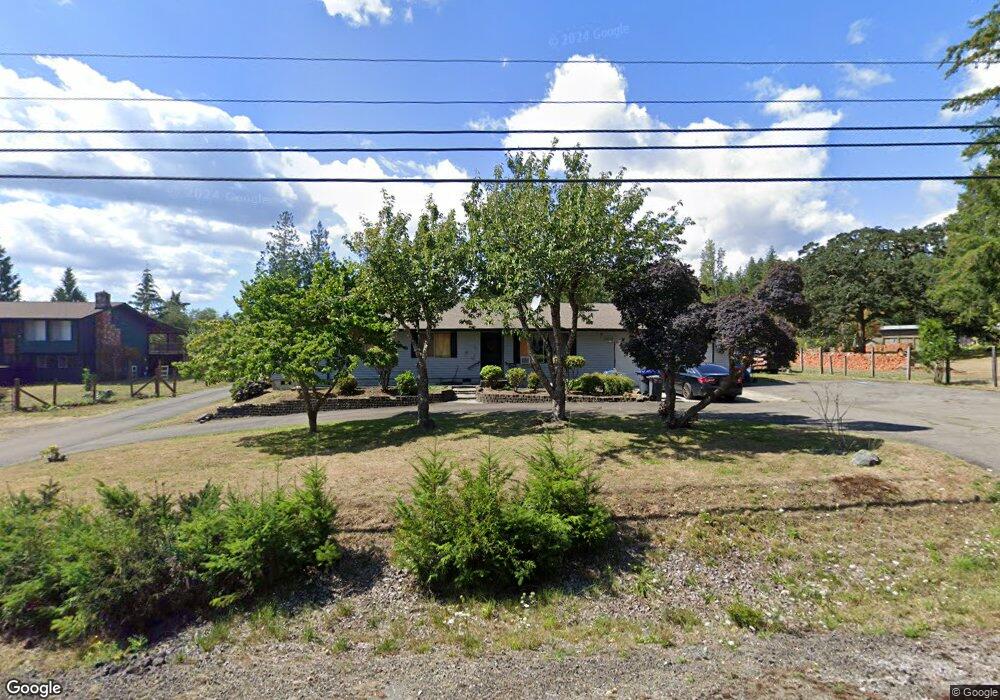
This home is located at 5661 E Grapeview Loop Rd, Allyn, WA 98524 and is currently estimated at $469,949, approximately $321 per square foot. 5661 E Grapeview Loop Rd is a home located in Mason County with nearby schools including Grapeview Elementary/Middle School.
Ownership History
Date
Name
Owned For
Owner Type
Purchase Details
Closed on
Sep 23, 2009
Sold by
Fannie Mae
Bought by
Miller Kathleen J
Current Estimated Value
Home Financials for this Owner
Home Financials are based on the most recent Mortgage that was taken out on this home.
Original Mortgage
$72,000
Outstanding Balance
$46,824
Interest Rate
5.08%
Mortgage Type
New Conventional
Estimated Equity
$423,125
Purchase Details
Closed on
Aug 13, 2008
Sold by
Bell Betty J
Bought by
Federal National Mortgage Association
Purchase Details
Closed on
Dec 20, 2005
Sold by
Madson Peters Helen L and Madsen Helen L
Bought by
Bell Betty J
Home Financials for this Owner
Home Financials are based on the most recent Mortgage that was taken out on this home.
Original Mortgage
$45,380
Interest Rate
5.88%
Mortgage Type
Stand Alone Second
Create a Home Valuation Report for This Property
The Home Valuation Report is an in-depth analysis detailing your home's value as well as a comparison with similar homes in the area
Purchase History
| Date | Buyer | Sale Price | Title Company |
|---|---|---|---|
| Miller Kathleen J | $129,900 | Land Title Co | |
| Federal National Mortgage Association | $190,337 | Land Title Co | |
| Bell Betty J | $227,180 | First American Title |
Source: Public Records
Mortgage History
| Date | Status | Borrower | Loan Amount |
|---|---|---|---|
| Open | Miller Kathleen J | $72,000 | |
| Previous Owner | Bell Betty J | $45,380 | |
| Previous Owner | Bell Betty J | $181,520 |
Source: Public Records
Tax History
| Year | Tax Paid | Tax Assessment Tax Assessment Total Assessment is a certain percentage of the fair market value that is determined by local assessors to be the total taxable value of land and additions on the property. | Land | Improvement |
|---|---|---|---|---|
| 2025 | $3,042 | $402,205 | $92,565 | $309,640 |
| 2023 | $3,042 | $357,340 | $91,180 | $266,160 |
| 2022 | $2,861 | $323,550 | $58,790 | $264,760 |
| 2021 | $2,484 | $323,550 | $58,790 | $264,760 |
| 2020 | $2,188 | $279,885 | $45,225 | $234,660 |
| 2018 | $2,125 | $194,360 | $34,410 | $159,950 |
| 2017 | $1,834 | $194,360 | $34,410 | $159,950 |
| 2016 | $1,707 | $178,180 | $32,770 | $145,410 |
| 2015 | $1,675 | $165,340 | $38,745 | $126,595 |
| 2014 | -- | $155,935 | $34,650 | $121,285 |
| 2013 | -- | $144,655 | $29,925 | $114,730 |
Source: Public Records
Map
Nearby Homes
- 5440 E Grapeview Loop Rd
- 90 E Treasure Island Dr
- 7104 E Grapeview Loop Rd
- 101 E Pirates Place
- 7360 E Grapeview Loop Rd
- 0 E Murray Rd N Unit NWM2467437
- 17717 E State Route 3
- 17991 E State Route 3
- 61 E Channel Dr
- 41 E Westlake Place
- 116th 166th St NW
- 40 E Lakeshore Dr
- 11515 189th Ave NW Unit Lot 2
- 11515 189th Ave NW
- 18909 115th St NW
- 0 E Wheelwright St S
- 310 E Rauschert Rd
- 7504 Crescent Beach Rd NW
- 31 E Village View Dr
- 170 E Lakeland Dr
- 5641 E Grapeview Loop Rd
- 5671 E Grapeview Loop Rd
- 5631 E Grapeview Loop Rd
- 90 E Country Ln
- 40 E Oakdale St
- 140 141& 230 Douglas Fir Ln
- 130 Douglas Fir Ln
- 230 Douglas Fir Ln
- 91 E Country Ln
- 20 E Oakdale St
- 60 E Oakdale St
- 86 E Oakdale St
- 5741 E Grapeview Loop Rd
- 82 E Oakdale St
- 84 E Oakdale St
- 5713 E Grapeview Loop Rd
- 80 E Oakdale St
- 0 43XX Grapeview Loop Rd
- 0 E2318 Grapeview Loop Rd
- 2 Grapeview Loop Rd
Your Personal Tour Guide
Ask me questions while you tour the home.