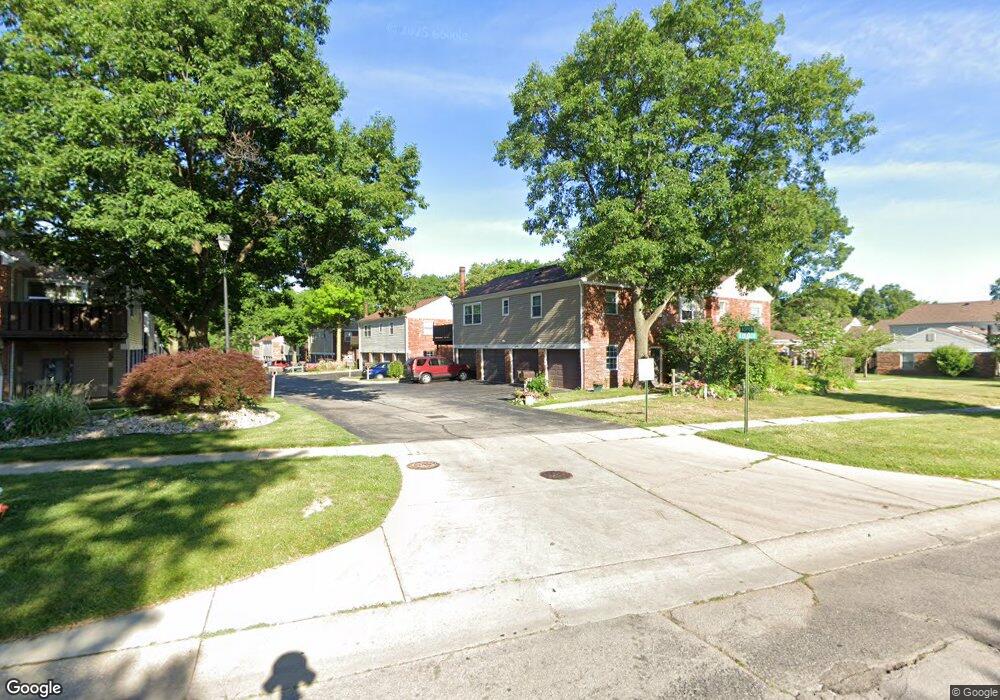
5662 Aspen Dr Unit 2 Toledo, OH 43615
Reynolds Corners NeighborhoodEstimated Value: $144,000 - $165,000
3
Beds
3
Baths
1,322
Sq Ft
$118/Sq Ft
Est. Value
About This Home
This home is located at 5662 Aspen Dr Unit 2, Toledo, OH 43615 and is currently estimated at $156,115, approximately $118 per square foot. 5662 Aspen Dr Unit 2 is a home located in Lucas County with nearby schools including Holloway Elementary School, Springfield Middle School, and Springfield High School.
Ownership History
Date
Name
Owned For
Owner Type
Purchase Details
Closed on
May 29, 2020
Sold by
Rospert Properties Ii
Bought by
Neal Amy M
Current Estimated Value
Home Financials for this Owner
Home Financials are based on the most recent Mortgage that was taken out on this home.
Original Mortgage
$75,200
Outstanding Balance
$66,512
Interest Rate
3.2%
Mortgage Type
New Conventional
Estimated Equity
$89,603
Purchase Details
Closed on
May 23, 2016
Sold by
Holmes Mary Ann
Bought by
Rospert Properties Ii
Purchase Details
Closed on
Feb 12, 2016
Sold by
Fannie Mae
Bought by
Holmws Maryann
Purchase Details
Closed on
Aug 4, 2015
Sold by
Vanderhorst Patricia K
Bought by
Federal National Mortgage Association
Purchase Details
Closed on
Mar 31, 1993
Sold by
Dejute Leah Ann
Purchase Details
Closed on
Sep 20, 1989
Sold by
Dejute Leah Ann and Dejute James A
Create a Home Valuation Report for This Property
The Home Valuation Report is an in-depth analysis detailing your home's value as well as a comparison with similar homes in the area
Home Values in the Area
Average Home Value in this Area
Purchase History
| Date | Buyer | Sale Price | Title Company |
|---|---|---|---|
| Neal Amy M | $94,000 | None Available | |
| Rospert Properties Ii | $82,500 | None Available | |
| Holmws Maryann | -- | Omega Title Agency Llc | |
| Federal National Mortgage Association | $42,667 | None Available | |
| -- | $60,000 | -- | |
| -- | -- | -- |
Source: Public Records
Mortgage History
| Date | Status | Borrower | Loan Amount |
|---|---|---|---|
| Open | Neal Amy M | $75,200 |
Source: Public Records
Tax History Compared to Growth
Tax History
| Year | Tax Paid | Tax Assessment Tax Assessment Total Assessment is a certain percentage of the fair market value that is determined by local assessors to be the total taxable value of land and additions on the property. | Land | Improvement |
|---|---|---|---|---|
| 2024 | $1,036 | $39,550 | $2,240 | $37,310 |
| 2023 | $1,662 | $26,950 | $1,715 | $25,235 |
| 2022 | $1,663 | $26,950 | $1,715 | $25,235 |
| 2021 | $1,706 | $26,950 | $1,715 | $25,235 |
| 2020 | $1,750 | $24,185 | $1,400 | $22,785 |
| 2019 | $1,704 | $24,185 | $1,400 | $22,785 |
| 2018 | $1,826 | $24,185 | $1,400 | $22,785 |
| 2017 | $1,989 | $26,670 | $2,695 | $23,975 |
| 2016 | $1,972 | $76,200 | $7,700 | $68,500 |
| 2015 | $1,970 | $76,200 | $7,700 | $68,500 |
| 2014 | $1,771 | $26,680 | $2,700 | $23,980 |
| 2013 | $1,771 | $26,680 | $2,700 | $23,980 |
Source: Public Records
Map
Nearby Homes
- 5662 Bernath Ct Unit E
- 5705 Aspen Dr
- 5615 Baronswood Cir
- 1562 Saddlebrook Ct Unit B
- 1533 Eaglebrook Rd
- 1183 Hidden Ridge Rd
- 1187 Hidden Ridge Rd Unit A
- 1144 Bernath Pkwy Unit D
- 5560 Greenridge Dr
- 5860 Cresthaven Ln
- 5150 Norton Place
- 5222 Mardone Dr
- 715 S Holland Sylvania Rd
- 5702 Angola Rd
- 5026 Geer Ln
- 38 Walnut Creek Dr
- 1104 S Reynolds Rd
- 4860 Eastwick Dr
- 4866 Airport Hwy
- 2001 Perrysburg Holland Rd
- 5662 Aspen Dr
- 5660 Aspen Dr Unit 4R
- 5658 Aspen Dr Unit 3TL
- 5704 Aspen Dr Unit R8
- 5704 Aspen Dr Unit B
- 5706 Aspen Dr Unit 6TR
- 5666 Aspen Dr Unit C5
- 5666 Aspen Dr Unit 5
- 5703 Bernath Ct
- 5702 Aspen Dr
- 5702 Aspen Dr Unit 7
- 5701 Aspen Dr Unit 12C25
- 5659 Bernath Ct Unit J
- 5661 Bernath Ct
- 5701 Bernath Ct
- 5663 Aspen Dr
- 5712 Aspen Dr
- 5712 Aspen Dr Unit 10
- 5708 Aspen Dr Unit 11
- 5705 Bernath Ct Unit GL