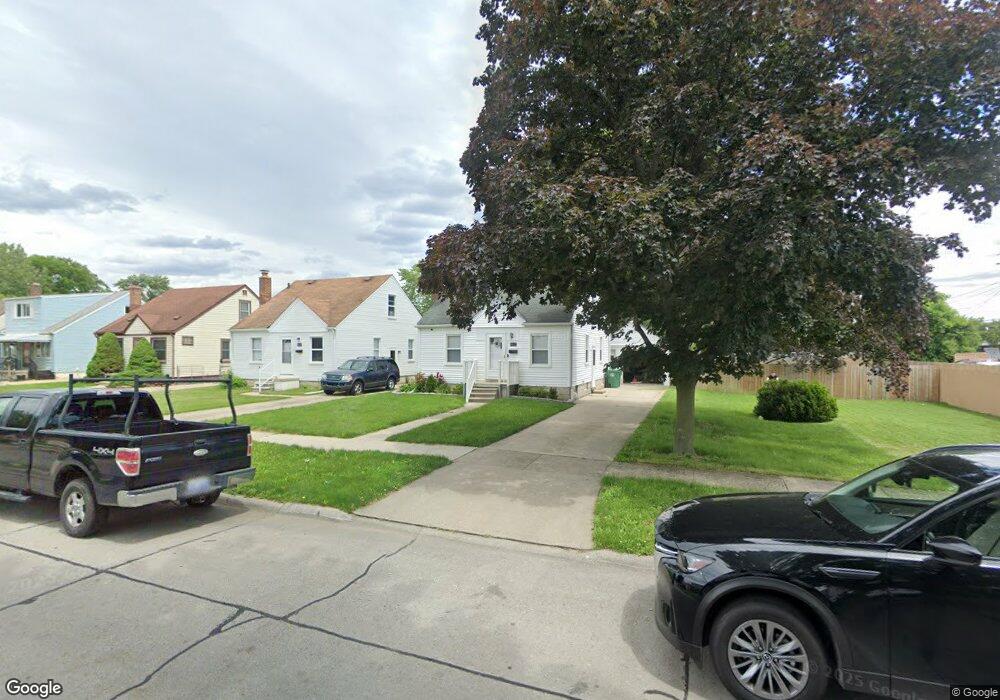
5662 Gilman St Unit Bldg-Unit Garden City, MI 48135
Estimated Value: $182,000 - $213,000
--
Bed
1
Bath
1,080
Sq Ft
$187/Sq Ft
Est. Value
About This Home
This home is located at 5662 Gilman St Unit Bldg-Unit, Garden City, MI 48135 and is currently estimated at $202,150, approximately $187 per square foot. 5662 Gilman St Unit Bldg-Unit is a home located in Wayne County with nearby schools including Douglas Elementary 3-4 Campus, Memorial Elementary 1-2 Campus, and Garden City Middle School.
Ownership History
Date
Name
Owned For
Owner Type
Purchase Details
Closed on
Apr 18, 2023
Sold by
Hanson Hunter
Bought by
Escobar Alejandra G Alvarez and Escobar Carlos Felipe
Current Estimated Value
Home Financials for this Owner
Home Financials are based on the most recent Mortgage that was taken out on this home.
Original Mortgage
$162,000
Outstanding Balance
$157,604
Interest Rate
6.73%
Mortgage Type
New Conventional
Estimated Equity
$44,546
Purchase Details
Closed on
Jun 25, 2020
Sold by
Risch Michael
Bought by
Hanson Hunter
Purchase Details
Closed on
Jun 27, 2018
Sold by
Bearden Michael
Bought by
Risch Michael
Purchase Details
Closed on
Jun 11, 2012
Sold by
Risch Richard
Bought by
Bearden Michael
Purchase Details
Closed on
Dec 18, 2009
Sold by
Risch Doris M and Risch Raymond J
Bought by
Risch Doris M and Doris M Risch Trust
Create a Home Valuation Report for This Property
The Home Valuation Report is an in-depth analysis detailing your home's value as well as a comparison with similar homes in the area
Home Values in the Area
Average Home Value in this Area
Purchase History
| Date | Buyer | Sale Price | Title Company |
|---|---|---|---|
| Escobar Alejandra G Alvarez | $180,000 | Select Title | |
| Hanson Hunter | $140,100 | Stg | |
| Risch Michael | $135,000 | Reputation Firs Title Agency | |
| Bearden Michael | $55,000 | First Centennial Title Inc | |
| Risch Doris M | -- | None Available |
Source: Public Records
Mortgage History
| Date | Status | Borrower | Loan Amount |
|---|---|---|---|
| Open | Escobar Alejandra G Alvarez | $162,000 |
Source: Public Records
Tax History Compared to Growth
Tax History
| Year | Tax Paid | Tax Assessment Tax Assessment Total Assessment is a certain percentage of the fair market value that is determined by local assessors to be the total taxable value of land and additions on the property. | Land | Improvement |
|---|---|---|---|---|
| 2025 | $3,725 | $81,100 | $0 | $0 |
| 2024 | $3,725 | $73,200 | $0 | $0 |
| 2023 | $2,850 | $65,800 | $0 | $0 |
| 2022 | $3,190 | $55,200 | $0 | $0 |
| 2021 | $3,120 | $50,900 | $0 | $0 |
| 2020 | $2,733 | $49,500 | $0 | $0 |
| 2019 | $2,248 | $42,700 | $0 | $0 |
| 2018 | $1,253 | $36,200 | $0 | $0 |
| 2017 | $411 | $34,100 | $0 | $0 |
| 2016 | $1,428 | $30,300 | $0 | $0 |
| 2015 | $2,418 | $26,800 | $0 | $0 |
| 2013 | $2,410 | $25,000 | $0 | $0 |
| 2012 | -- | $26,300 | $8,900 | $17,400 |
Source: Public Records
Map
Nearby Homes
- 5803 Deering St
- 5851 Gilman St
- 2019 Helen St
- 5706 Cardwell St
- 1782 Gilman St
- 6150 Gilman St
- 28462 Birchlawn St
- 6169 Gilman St
- 28530 John Hauk St
- 1745 Cardwell St
- 28663 Birchlawn St
- 116 Arcola St
- 28538 Block St
- 28649 John Hauk St
- 6051 Arcola St
- 6253 Lathers St
- 28614 Block St
- 6326 Lathers St
- 28343 Maplewood St
- 28832 Block St