Estimated Value: $341,000 - $371,000
3
Beds
1
Bath
996
Sq Ft
$360/Sq Ft
Est. Value
About This Home
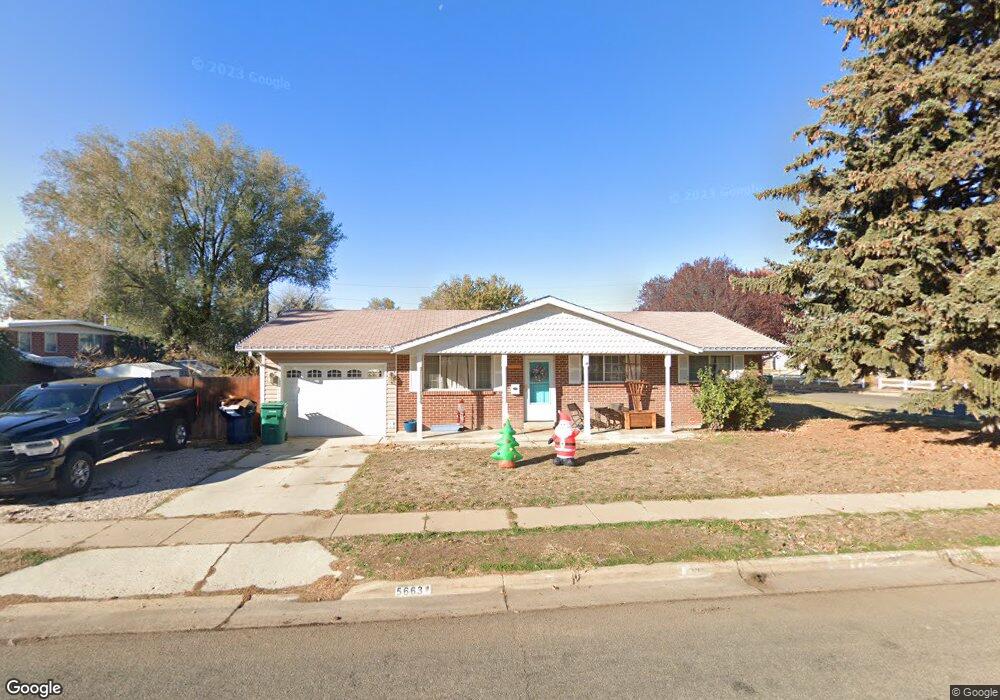
This home is located at 5663 S 2600 W, Roy, UT 84067 and is currently estimated at $358,727, approximately $360 per square foot. 5663 S 2600 W is a home located in Weber County with nearby schools including Roy Elementary School, Roy Junior High School, and Roy High School.
Ownership History
Date
Name
Owned For
Owner Type
Purchase Details
Closed on
Jul 21, 2021
Sold by
Corsarios 1 Llc
Bought by
Slater Kirsten
Current Estimated Value
Home Financials for this Owner
Home Financials are based on the most recent Mortgage that was taken out on this home.
Original Mortgage
$299,653
Outstanding Balance
$272,302
Interest Rate
3%
Mortgage Type
FHA
Estimated Equity
$86,425
Purchase Details
Closed on
Apr 15, 2021
Sold by
Miller Jordan and Miller Kailey
Bought by
Corsarios I Llc
Home Financials for this Owner
Home Financials are based on the most recent Mortgage that was taken out on this home.
Original Mortgage
$177,000
Interest Rate
3%
Mortgage Type
Purchase Money Mortgage
Create a Home Valuation Report for This Property
The Home Valuation Report is an in-depth analysis detailing your home's value as well as a comparison with similar homes in the area
Home Values in the Area
Average Home Value in this Area
Purchase History
| Date | Buyer | Sale Price | Title Company |
|---|---|---|---|
| Slater Kirsten | -- | Richland Title Ins Agcy Inc | |
| Corsarios I Llc | -- | Richland Title | |
| Corsarios I Llc | -- | Richland Title |
Source: Public Records
Mortgage History
| Date | Status | Borrower | Loan Amount |
|---|---|---|---|
| Open | Slater Kirsten | $299,653 | |
| Previous Owner | Corsarios I Llc | $177,000 |
Source: Public Records
Tax History Compared to Growth
Tax History
| Year | Tax Paid | Tax Assessment Tax Assessment Total Assessment is a certain percentage of the fair market value that is determined by local assessors to be the total taxable value of land and additions on the property. | Land | Improvement |
|---|---|---|---|---|
| 2025 | $2,104 | $324,466 | $110,000 | $214,466 |
| 2024 | $2,037 | $173,799 | $60,509 | $113,290 |
| 2023 | $1,942 | $165,550 | $57,745 | $107,805 |
| 2022 | $2,175 | $194,150 | $55,008 | $139,142 |
| 2021 | $1,641 | $237,000 | $65,022 | $171,978 |
| 2020 | $1,511 | $200,000 | $65,022 | $134,978 |
| 2019 | $1,484 | $185,000 | $40,002 | $144,998 |
| 2018 | $1,337 | $155,000 | $35,083 | $119,917 |
| 2017 | $1,266 | $137,000 | $35,083 | $101,917 |
| 2016 | $1,197 | $69,329 | $19,237 | $50,092 |
| 2015 | $1,070 | $62,254 | $21,944 | $40,310 |
| 2014 | $184 | $58,011 | $16,499 | $41,512 |
Source: Public Records
Map
Nearby Homes
- 2646 W 5625 S Unit M-2646
- 2571 W 5725 S
- 2672 W 5750 S
- 2587 W 5750 S
- 5810 S 2550 W
- 2778 W 5550 S Unit 28
- 5568 S 2800 W Unit 5B
- 2786 W 5550 S Unit C11
- 2778 W 5400 S
- 5317 S 2690 W
- 5643 S 2200 W
- 5326 S 2675 W
- 2907 W 5775 S
- 5345 S 2425 W
- 2829 W 5925 S
- 2995 W 5750 S
- 5573 S 2150 W
- 2184 W 5500 S
- 2146 W 5600 S Unit 29
- 5545 S 2100 W Unit 12