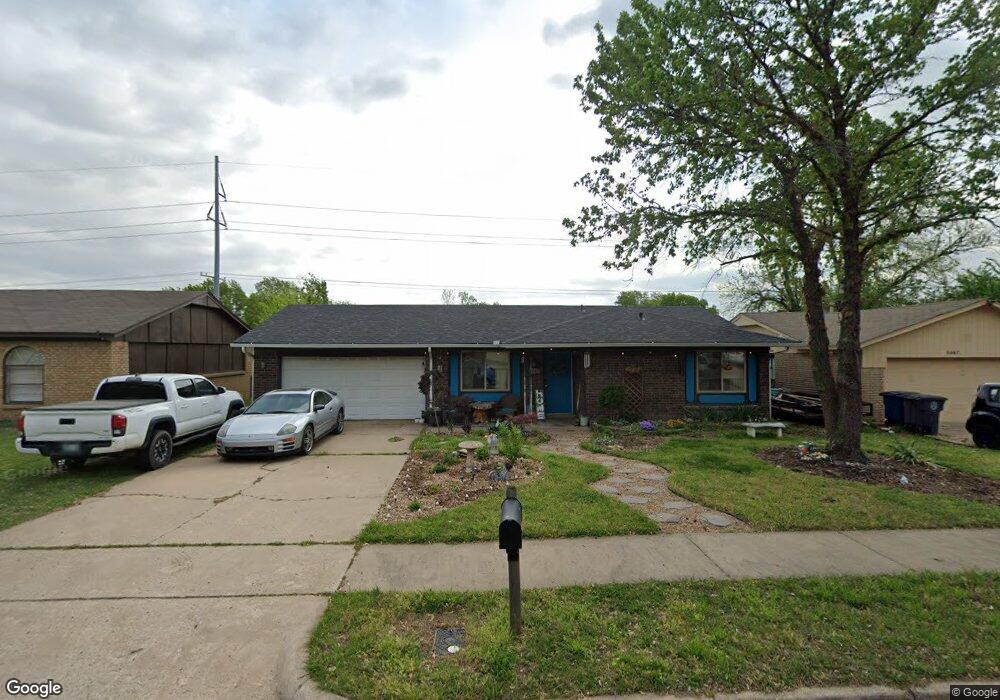
5663 S 88th Ave E Tulsa, OK 74145
Stevenson NeighborhoodEstimated Value: $163,011 - $184,000
Studio
1
Bath
954
Sq Ft
$185/Sq Ft
Est. Value
About This Home
This home is located at 5663 S 88th Ave E, Tulsa, OK 74145 and is currently estimated at $176,753, approximately $185 per square foot. 5663 S 88th Ave E is a home located in Tulsa County with nearby schools including Grove Elementary School, Union 6th-7th Grade Center, and Union 8th Grade Center.
Ownership History
Date
Name
Owned For
Owner Type
Purchase Details
Closed on
Jun 4, 2019
Sold by
Hooko James I
Bought by
Canup Brandon
Current Estimated Value
Home Financials for this Owner
Home Financials are based on the most recent Mortgage that was taken out on this home.
Original Mortgage
$106,534
Outstanding Balance
$93,278
Interest Rate
4.2%
Mortgage Type
FHA
Estimated Equity
$83,475
Purchase Details
Closed on
Mar 6, 2017
Sold by
Victor Erin E
Bought by
Hooko James Ivan
Home Financials for this Owner
Home Financials are based on the most recent Mortgage that was taken out on this home.
Original Mortgage
$101,332
Interest Rate
4.19%
Mortgage Type
VA
Purchase Details
Closed on
Apr 29, 2013
Sold by
Koleber Melvin L and Koleber Kim Marie
Bought by
Victor Erin E
Home Financials for this Owner
Home Financials are based on the most recent Mortgage that was taken out on this home.
Original Mortgage
$88,860
Interest Rate
3.61%
Mortgage Type
FHA
Create a Home Valuation Report for This Property
The Home Valuation Report is an in-depth analysis detailing your home's value as well as a comparison with similar homes in the area
Home Values in the Area
Average Home Value in this Area
Purchase History
| Date | Buyer | Sale Price | Title Company |
|---|---|---|---|
| Canup Brandon | $108,500 | Apex Ttl & Closing Svcs Llc | |
| Hooko James Ivan | -- | First American Title | |
| Victor Erin E | $90,500 | Nations Title Of Okc |
Source: Public Records
Mortgage History
| Date | Status | Borrower | Loan Amount |
|---|---|---|---|
| Open | Canup Brandon | $106,534 | |
| Previous Owner | Hooko James Ivan | $101,332 | |
| Previous Owner | Victor Erin E | $88,860 |
Source: Public Records
Tax History
| Year | Tax Paid | Tax Assessment Tax Assessment Total Assessment is a certain percentage of the fair market value that is determined by local assessors to be the total taxable value of land and additions on the property. | Land | Improvement |
|---|---|---|---|---|
| 2025 | $1,935 | $14,151 | $3,109 | $11,042 |
| 2024 | $1,683 | $13,477 | $3,545 | $9,932 |
| 2023 | $1,683 | $13,159 | $3,182 | $9,977 |
| 2022 | $1,670 | $12,532 | $3,384 | $9,148 |
| 2021 | $1,611 | $11,935 | $3,223 | $8,712 |
| 2020 | $1,587 | $11,935 | $3,223 | $8,712 |
| 2019 | $1,369 | $9,945 | $2,929 | $7,016 |
| 2018 | $1,366 | $9,945 | $2,929 | $7,016 |
| 2017 | $1,375 | $9,955 | $3,223 | $6,732 |
| 2016 | $1,345 | $9,955 | $3,223 | $6,732 |
| 2015 | $1,359 | $9,955 | $3,223 | $6,732 |
| 2014 | $1,338 | $9,955 | $3,223 | $6,732 |
Source: Public Records
Map
Nearby Homes
- 5662 S 85th East Ave
- 8949 E 60th St
- 9003 E 60th Place
- 9006 E 60th Place
- 8931 E 62nd Place S
- 9011 E 62nd Place S
- 9063 E 62nd Place S
- 9105 E 62nd Place S
- 9069 E 62nd Place S
- 9057 E 62nd Place S
- 9053 E 62nd Place S
- 9056 E 62nd Place S
- 5716 S 80th East Ave
- 6262 S 90th East Place
- 9111 E 62nd Ct S
- 9214 E 62nd Ct S
- 9208 E 62nd Ct S
- 6253 S 92nd East Ave
- 9017 E 63rd St
- 9202 E 62nd Ct S
- 5663 S 88th East Ave
- 5667 S 88th East Ave
- 5657 S 88th East Ave
- 5671 S 88th East Ave
- 5651 S 88th East Ave
- 5704 S 89th East Ave
- 5660 S 89th East Ave
- 5704 S 89th Ave E
- 5660 S 89th East Ave
- 5654 S 88th East Ave
- 5656 S 89th East Ave
- 5710 S 89th East Ave
- 5677 S 88th East Ave
- 5647 S 88th East Ave
- 5656 S 89th East Ave
- 5664 S 88th East Ave
- 5660 S 88th East Ave
- 5652 S 89th East Ave
- 5714 S 89th East Ave
- 5670 S 88th East Ave
Your Personal Tour Guide
Ask me questions while you tour the home.