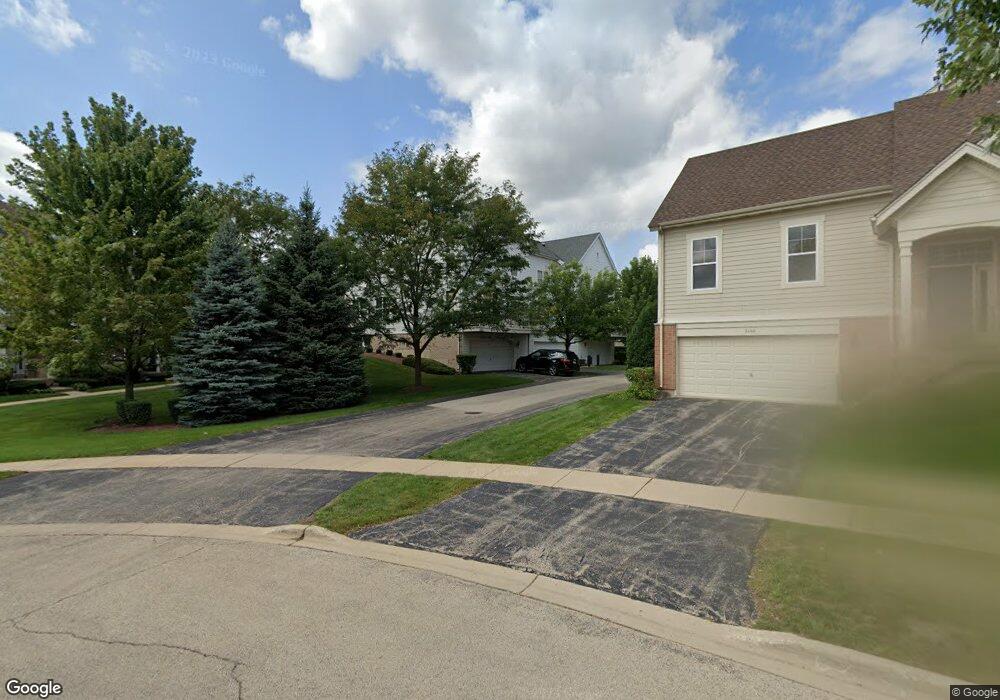
5664 Cambridge Way Hanover Park, IL 60133
South Tri Village NeighborhoodEstimated Value: $379,000 - $389,518
4
Beds
4
Baths
2,529
Sq Ft
$152/Sq Ft
Est. Value
About This Home
This home is located at 5664 Cambridge Way, Hanover Park, IL 60133 and is currently estimated at $384,630, approximately $152 per square foot. 5664 Cambridge Way is a home located in DuPage County with nearby schools including Greenbrook Elementary School, Spring Wood Middle School, and Lake Park High School.
Ownership History
Date
Name
Owned For
Owner Type
Purchase Details
Closed on
Jan 27, 2016
Sold by
Tran Benjamin Q and Benjamin Q Tran Declaration Of
Bought by
Le Hung V and Nguyen Thuy
Current Estimated Value
Home Financials for this Owner
Home Financials are based on the most recent Mortgage that was taken out on this home.
Original Mortgage
$190,000
Outstanding Balance
$80,317
Interest Rate
3.5%
Mortgage Type
FHA
Estimated Equity
$304,313
Purchase Details
Closed on
Feb 22, 2008
Sold by
Tran Benjamin Q and Tran Lana H
Bought by
Tran Benjamin Q and Tran Lana H
Purchase Details
Closed on
Mar 18, 2004
Sold by
Drh Cambridge Homes Inc
Bought by
Tran Ben Q and Tran Lana H
Home Financials for this Owner
Home Financials are based on the most recent Mortgage that was taken out on this home.
Original Mortgage
$256,750
Interest Rate
4.87%
Mortgage Type
Purchase Money Mortgage
Create a Home Valuation Report for This Property
The Home Valuation Report is an in-depth analysis detailing your home's value as well as a comparison with similar homes in the area
Home Values in the Area
Average Home Value in this Area
Purchase History
| Date | Buyer | Sale Price | Title Company |
|---|---|---|---|
| Le Hung V | $200,000 | Chicago Title | |
| Tran Benjamin Q | -- | None Available | |
| Tran Ben Q | $321,000 | 1St American Title |
Source: Public Records
Mortgage History
| Date | Status | Borrower | Loan Amount |
|---|---|---|---|
| Open | Le Hung V | $190,000 | |
| Previous Owner | Tran Ben Q | $256,750 |
Source: Public Records
Tax History Compared to Growth
Tax History
| Year | Tax Paid | Tax Assessment Tax Assessment Total Assessment is a certain percentage of the fair market value that is determined by local assessors to be the total taxable value of land and additions on the property. | Land | Improvement |
|---|---|---|---|---|
| 2024 | $9,030 | $108,366 | $14,336 | $94,030 |
| 2023 | $8,646 | $99,100 | $13,110 | $85,990 |
| 2022 | $8,845 | $98,450 | $13,020 | $85,430 |
| 2021 | $8,571 | $93,540 | $12,370 | $81,170 |
| 2020 | $8,566 | $91,260 | $12,070 | $79,190 |
| 2019 | $8,343 | $87,700 | $11,600 | $76,100 |
| 2018 | $8,866 | $88,100 | $11,300 | $76,800 |
| 2017 | $8,551 | $81,650 | $10,470 | $71,180 |
| 2016 | $7,633 | $75,570 | $9,690 | $65,880 |
| 2015 | $7,652 | $70,520 | $9,040 | $61,480 |
| 2014 | $6,652 | $62,660 | $9,040 | $53,620 |
| 2013 | $6,563 | $64,800 | $9,350 | $55,450 |
Source: Public Records
Map
Nearby Homes
- 5662 Cambridge Way
- 1183 Hialeah Ln
- 1239 San Simeon Dr Unit 186
- 5563 Court f Unit 177
- 5567 Court f Unit 179
- 1225 Court c Unit 59
- 1233 Citation Ln
- 1336 Court o Unit 225
- 5500 Court p Unit 263
- 5540 Pebblebeach Dr Unit 284
- 6N505 Gary Ave
- 6N632 Gary Ave
- Lot Foster Ave
- 5775 Madrid Ct Unit A
- 1370 Alpine Ct Unit A
- 5815 Wilshire Ct Unit B
- 6N447 Virginia Rd
- 1607 W Celebrity Cir
- 515 Dover Ct
- 6N331 Keeney Rd
- 5660 Cambridge Way
- 5650 Cambridge Way
- 5684 Cambridge Way
- 5686 Cambridge Way
- 5648 Cambridge Way
- 5688 Cambridge Way
- 5682 Cambridge Way
- 5690 Cambridge Way
- 5646 Cambridge Way
- 5680 Cambridge Way
- 5644 Cambridge Way
- 5642 Cambridge Way
- 5640 Cambridge Way
- 5630 Cambridge Way
- 5628 Cambridge Way
- 5626 Cambridge Way
- 5624 Cambridge Way
- 5622 Cambridge Way
- 5622 Cambridge Way Unit 5622
- 5620 Cambridge Way