Estimated Value: $222,581 - $269,000
3
Beds
1
Bath
1,528
Sq Ft
$161/Sq Ft
Est. Value
About This Home
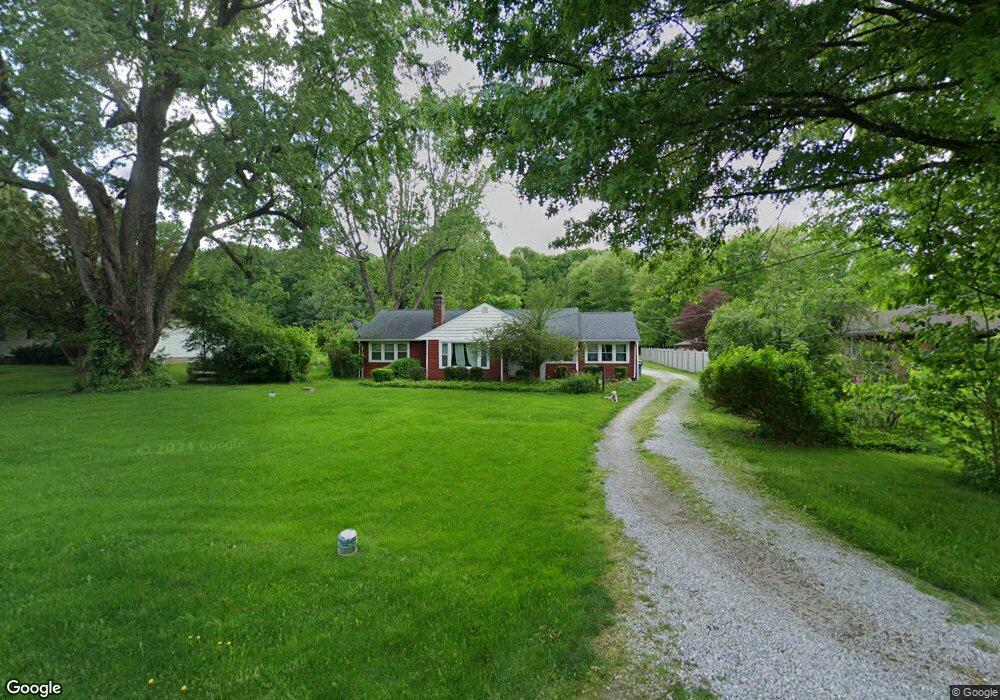
This home is located at 5664 Myers Rd, Akron, OH 44319 and is currently estimated at $245,895, approximately $160 per square foot. 5664 Myers Rd is a home located in Summit County with nearby schools including St. Francis de Sales School.
Ownership History
Date
Name
Owned For
Owner Type
Purchase Details
Closed on
Jan 5, 2021
Sold by
Reese Angela and Johnson Angela M
Bought by
Reese Angela and Reese Matthew J
Current Estimated Value
Home Financials for this Owner
Home Financials are based on the most recent Mortgage that was taken out on this home.
Original Mortgage
$132,100
Outstanding Balance
$95,685
Interest Rate
2.26%
Mortgage Type
New Conventional
Estimated Equity
$150,210
Purchase Details
Closed on
Aug 12, 2010
Sold by
Mills Gloria F
Bought by
Johnson Angela M
Home Financials for this Owner
Home Financials are based on the most recent Mortgage that was taken out on this home.
Original Mortgage
$133,206
Interest Rate
5.5%
Mortgage Type
FHA
Purchase Details
Closed on
Jan 23, 2000
Sold by
Mills Robert C and Mills Gloria F
Bought by
Mills Gloria F and The Revocable Gloria F Mills Trust
Create a Home Valuation Report for This Property
The Home Valuation Report is an in-depth analysis detailing your home's value as well as a comparison with similar homes in the area
Home Values in the Area
Average Home Value in this Area
Purchase History
| Date | Buyer | Sale Price | Title Company |
|---|---|---|---|
| Reese Angela | -- | None Listed On Document | |
| Johnson Angela M | $135,000 | Village Title | |
| Mills Gloria F | -- | -- |
Source: Public Records
Mortgage History
| Date | Status | Borrower | Loan Amount |
|---|---|---|---|
| Open | Reese Angela | $132,100 | |
| Previous Owner | Johnson Angela M | $133,206 |
Source: Public Records
Tax History Compared to Growth
Tax History
| Year | Tax Paid | Tax Assessment Tax Assessment Total Assessment is a certain percentage of the fair market value that is determined by local assessors to be the total taxable value of land and additions on the property. | Land | Improvement |
|---|---|---|---|---|
| 2025 | $3,147 | $63,039 | $19,138 | $43,901 |
| 2024 | $3,147 | $63,039 | $19,138 | $43,901 |
| 2023 | $3,147 | $63,039 | $19,138 | $43,901 |
| 2022 | $3,183 | $49,683 | $13,573 | $36,110 |
| 2021 | $3,195 | $49,683 | $13,573 | $36,110 |
| 2020 | $3,139 | $49,680 | $13,570 | $36,110 |
| 2019 | $3,296 | $46,740 | $19,000 | $27,740 |
| 2018 | $2,843 | $46,740 | $19,000 | $27,740 |
| 2017 | $2,853 | $46,740 | $19,000 | $27,740 |
| 2016 | $2,819 | $42,490 | $19,000 | $23,490 |
| 2015 | $2,853 | $42,490 | $19,000 | $23,490 |
| 2014 | $2,831 | $42,490 | $19,000 | $23,490 |
| 2013 | $2,780 | $41,970 | $19,000 | $22,970 |
Source: Public Records
Map
Nearby Homes
- 451 Yager Rd
- 5776 Harter Home Dr
- 427 Center Rd
- 715 Highland Park Dr
- 781 Leeman Dr
- 6407 Southview Dr
- 6090 Manchester Rd Unit 6096
- 899 Loway Dr
- 1062 Stump Rd
- 5892 Woodward Dr
- 6387 Hampsher Rd
- S/L 14,15 Shakes Hotel Dr
- 4944 Coleman Dr
- 6 Shrakes Hotel Dr
- 4 Shrakes Hotel Dr
- 0 W Comet Rd Unit 5079117
- 7 Shrakes Hotel Dr
- 5 Shrakes Hotel Dr
- 3 Shrakes Hotel Dr
- 4881 S Main St