Estimated Value: $334,408 - $366,000
3
Beds
2
Baths
2,049
Sq Ft
$169/Sq Ft
Est. Value
About This Home
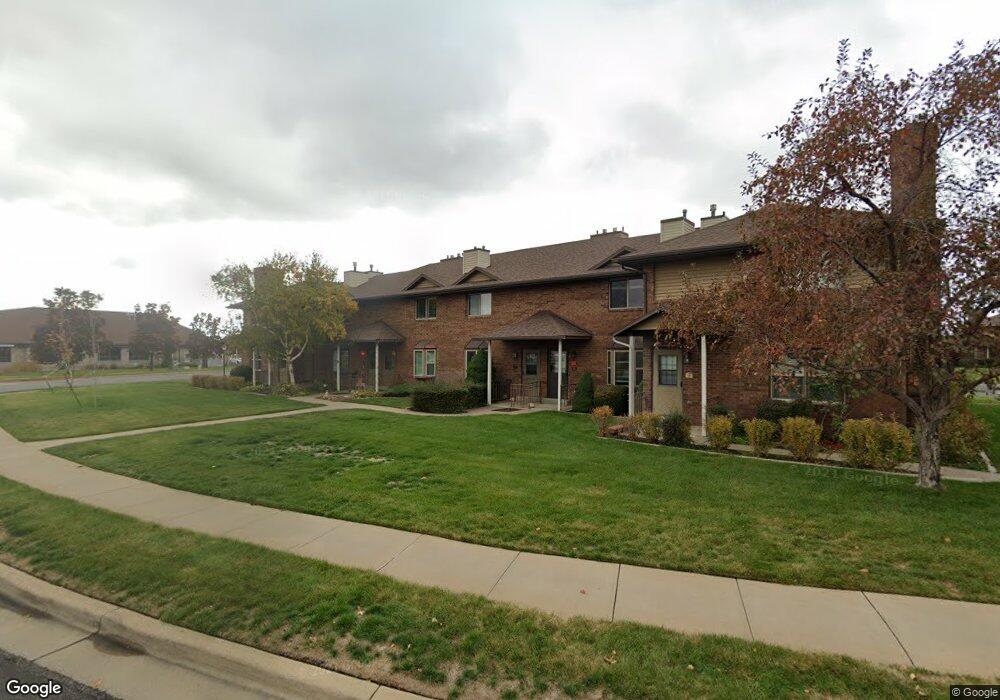
This home is located at 5665 S 1475 E Unit 5F, Ogden, UT 84403 and is currently estimated at $346,352, approximately $169 per square foot. 5665 S 1475 E Unit 5F is a home located in Weber County with nearby schools including Uintah School, South Ogden Junior High School, and Bonneville High School.
Ownership History
Date
Name
Owned For
Owner Type
Purchase Details
Closed on
Aug 8, 2019
Sold by
Barber Sunshine R
Bought by
Litster Michelle
Current Estimated Value
Home Financials for this Owner
Home Financials are based on the most recent Mortgage that was taken out on this home.
Original Mortgage
$183,148
Outstanding Balance
$160,960
Interest Rate
3.87%
Mortgage Type
FHA
Estimated Equity
$185,392
Purchase Details
Closed on
May 27, 2010
Sold by
Helen K Stephens Living Trust and Stephens Helen K
Bought by
Nomura Brittni S and Nomura Kent J
Home Financials for this Owner
Home Financials are based on the most recent Mortgage that was taken out on this home.
Original Mortgage
$120,378
Interest Rate
5.25%
Mortgage Type
FHA
Purchase Details
Closed on
Apr 15, 2008
Sold by
Stephens Helen K
Bought by
Helen K Stephens Living Trust and Stephens Helen K
Create a Home Valuation Report for This Property
The Home Valuation Report is an in-depth analysis detailing your home's value as well as a comparison with similar homes in the area
Home Values in the Area
Average Home Value in this Area
Purchase History
| Date | Buyer | Sale Price | Title Company |
|---|---|---|---|
| Litster Michelle | -- | Mountain View Title | |
| Nomura Brittni S | -- | Us Title Insurance Agency | |
| Helen K Stephens Living Trust | -- | None Available |
Source: Public Records
Mortgage History
| Date | Status | Borrower | Loan Amount |
|---|---|---|---|
| Open | Litster Michelle | $183,148 | |
| Previous Owner | Nomura Brittni S | $120,378 |
Source: Public Records
Tax History
| Year | Tax Paid | Tax Assessment Tax Assessment Total Assessment is a certain percentage of the fair market value that is determined by local assessors to be the total taxable value of land and additions on the property. | Land | Improvement |
|---|---|---|---|---|
| 2025 | $2,102 | $322,365 | $75,000 | $247,365 |
| 2024 | $2,003 | $172,700 | $41,250 | $131,450 |
| 2023 | $1,868 | $161,150 | $41,250 | $119,900 |
| 2022 | $1,833 | $161,700 | $41,250 | $120,450 |
| 2021 | $1,497 | $223,000 | $40,000 | $183,000 |
| 2020 | $1,484 | $207,000 | $30,000 | $177,000 |
| 2019 | $1,464 | $196,000 | $22,000 | $174,000 |
| 2018 | $1,354 | $172,000 | $22,000 | $150,000 |
| 2017 | $1,150 | $141,000 | $22,000 | $119,000 |
| 2016 | $966 | $66,550 | $11,000 | $55,550 |
| 2015 | $982 | $66,550 | $11,000 | $55,550 |
| 2014 | $824 | $55,000 | $11,000 | $44,000 |
Source: Public Records
Map
Nearby Homes
- 5660 S 1425 E Unit E3
- 5659 Fox Chase Dr
- 5619 S Fox Chase Dr E
- 1425 E 5850 S Unit 3D
- 5813 S Main Point Blvd
- 1842 E 5625 S Unit C
- 1805 E 5750 S
- 5630 Meadow Ln Unit 172
- 5630 Meadow Ln Unit 192
- 5660 S Meadow Ln Unit 140
- 5600 Meadow Ln Unit 144
- 5600 Meadow Ln Unit 193
- 1225 E 5275 S
- 5341 Fillmore Ave
- 1314 E 5250 S
- 5505 S 1025 E
- 5558 S 1025 E
- 1929 E 5625 S
- 1342 E 5200 S
- 5142 Sunset Way Unit 401
- 5665 S 1475 E Unit 5E
- 5665 S 1475 E Unit 5D
- 5665 S 1475 E Unit 5C
- 5665 S 1475 E Unit 5B
- 5665 S 1475 E Unit 5A
- 5670 S 1425 E Unit 4
- 5670 S 1425 E Unit 4E
- 5670 S 1425 E Unit 4D
- 5670 S 1425 E Unit 4C
- 5670 S 1425 E Unit 4B
- 5670 S 1425 E Unit 4A
- 5670 S 1425 E
- 5670 S 1425 E Unit B
- 5660 S 1425 E Unit 3F
- 5660 S 1425 E Unit 3E
- 5660 S 1425 E Unit 3D
- 5660 S 1425 E Unit 3C
- 5660 S 1425 E Unit 3B
- 5660 S 1425 E Unit 3A
- 5660 S 1425 E Unit 2B
Your Personal Tour Guide
Ask me questions while you tour the home.