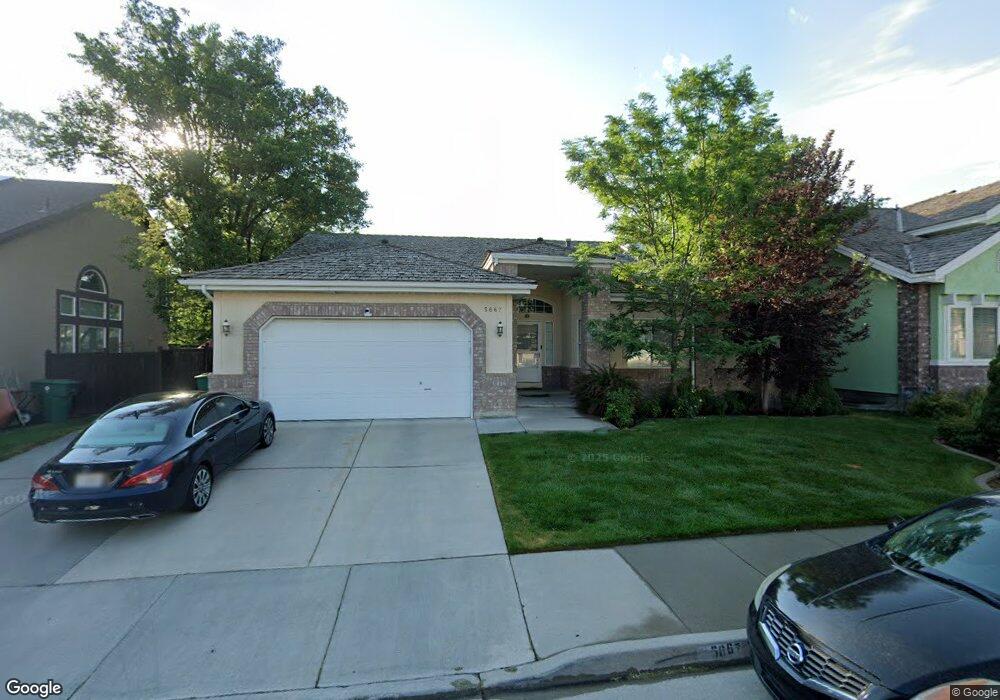
5667 S Adaley Ave Salt Lake City, UT 84107
Estimated Value: $645,000 - $810,000
4
Beds
3
Baths
3,671
Sq Ft
$206/Sq Ft
Est. Value
About This Home
This home is located at 5667 S Adaley Ave, Salt Lake City, UT 84107 and is currently estimated at $756,815, approximately $206 per square foot. 5667 S Adaley Ave is a home located in Salt Lake County with nearby schools including McMillan Elementary School, Hillcrest Junior High School, and Murray High School.
Ownership History
Date
Name
Owned For
Owner Type
Purchase Details
Closed on
Jul 29, 2020
Sold by
Hall Kenneth B
Bought by
Hall Kenneth B and Hall Amelia Burga
Current Estimated Value
Home Financials for this Owner
Home Financials are based on the most recent Mortgage that was taken out on this home.
Original Mortgage
$303,100
Outstanding Balance
$258,614
Interest Rate
3.2%
Mortgage Type
New Conventional
Estimated Equity
$498,201
Purchase Details
Closed on
Jul 20, 2020
Sold by
Hall Kenneth B and Hall Amelia Burga
Bought by
Hail Kenneth B
Home Financials for this Owner
Home Financials are based on the most recent Mortgage that was taken out on this home.
Original Mortgage
$303,100
Outstanding Balance
$258,614
Interest Rate
3.2%
Mortgage Type
New Conventional
Estimated Equity
$498,201
Purchase Details
Closed on
Apr 24, 2019
Sold by
Hall Kenneth B
Bought by
Hall Kenneth B and Hall Amelia Burga
Home Financials for this Owner
Home Financials are based on the most recent Mortgage that was taken out on this home.
Original Mortgage
$299,300
Interest Rate
4.3%
Mortgage Type
New Conventional
Purchase Details
Closed on
Jul 29, 2015
Sold by
Hall Kenneth B
Bought by
Hall Kenneth B and Burga Amelia
Home Financials for this Owner
Home Financials are based on the most recent Mortgage that was taken out on this home.
Original Mortgage
$286,000
Interest Rate
3.98%
Mortgage Type
New Conventional
Purchase Details
Closed on
Jul 28, 2015
Sold by
Hoskins Catherine C
Bought by
Hall Kenneth B
Home Financials for this Owner
Home Financials are based on the most recent Mortgage that was taken out on this home.
Original Mortgage
$286,000
Interest Rate
3.98%
Mortgage Type
New Conventional
Purchase Details
Closed on
Jan 12, 2006
Sold by
Hoskins Catherine C
Bought by
Hoskins Catherine C and Catherine C Hoskins Trust
Purchase Details
Closed on
Dec 8, 1999
Sold by
Nelson Nancy A and Kent Nelson M
Bought by
Hoskins Thomas D and Hoskins Catherine C
Home Financials for this Owner
Home Financials are based on the most recent Mortgage that was taken out on this home.
Original Mortgage
$154,000
Interest Rate
7.25%
Mortgage Type
Purchase Money Mortgage
Purchase Details
Closed on
Feb 18, 1997
Sold by
Nelson Miles Kent and Nelson Nancy Anne
Bought by
Nelson Nancy A and Kent Nelson M
Home Financials for this Owner
Home Financials are based on the most recent Mortgage that was taken out on this home.
Original Mortgage
$155,000
Interest Rate
7.34%
Mortgage Type
Purchase Money Mortgage
Create a Home Valuation Report for This Property
The Home Valuation Report is an in-depth analysis detailing your home's value as well as a comparison with similar homes in the area
Home Values in the Area
Average Home Value in this Area
Purchase History
| Date | Buyer | Sale Price | Title Company |
|---|---|---|---|
| Hall Kenneth B | -- | Accommodation | |
| Hail Kenneth B | -- | Cottonwood Title | |
| Hall Kenneth B | -- | Novation Title Ins Agcy | |
| Hall Kenneth B | -- | Novation Title Ins Agcy | |
| Hall Kenneth B | -- | Title Guarantee | |
| Hall Kenneth B | -- | Monument Title Ins Co | |
| Hoskins Catherine C | -- | None Available | |
| Hoskins Thomas D | -- | Sutherland Title | |
| Nelson Nancy A | -- | Superior Title Company |
Source: Public Records
Mortgage History
| Date | Status | Borrower | Loan Amount |
|---|---|---|---|
| Open | Hail Kenneth B | $303,100 | |
| Previous Owner | Hall Kenneth B | $299,300 | |
| Previous Owner | Hall Kenneth B | $286,000 | |
| Previous Owner | Hoskins Thomas D | $154,000 | |
| Previous Owner | Nelson Nancy A | $155,000 |
Source: Public Records
Tax History Compared to Growth
Tax History
| Year | Tax Paid | Tax Assessment Tax Assessment Total Assessment is a certain percentage of the fair market value that is determined by local assessors to be the total taxable value of land and additions on the property. | Land | Improvement |
|---|---|---|---|---|
| 2025 | $3,206 | $759,200 | $219,400 | $539,800 |
| 2024 | $3,206 | $711,000 | $212,600 | $498,400 |
| 2023 | $3,273 | $695,200 | $175,700 | $519,500 |
| 2022 | $3,286 | $663,700 | $172,200 | $491,500 |
| 2021 | $2,558 | $455,600 | $132,500 | $323,100 |
| 2020 | $2,569 | $433,000 | $129,300 | $303,700 |
| 2019 | $2,580 | $420,100 | $123,600 | $296,500 |
| 2018 | $2,345 | $389,600 | $123,600 | $266,000 |
| 2017 | $2,285 | $382,800 | $123,600 | $259,200 |
| 2016 | $2,210 | $408,000 | $123,600 | $284,400 |
| 2015 | $1,782 | $261,800 | $126,000 | $135,800 |
| 2014 | -- | $264,400 | $130,100 | $134,300 |
Source: Public Records
Map
Nearby Homes
- 5572 S Avalon Dr
- 404 E 5600 S
- 361 Mcmillan Ln
- 5762 S Mcmillan Cir
- 5597 S Hillside Dr
- 5561 S Willow Ln Unit F
- 5775 S Fashion Blvd
- 5555 S Willow Ln Unit E
- 5560 S Willow Ln Unit D
- 418 E Bridlewalk Ln
- 5758 Hillside Dr
- 602 E 5600 S
- 5519 S Willow Ln Unit C
- 421 E Saunders St
- 5508 S Willow Ln
- 5440 Alpine Dr
- 5461 S Willow Ln
- 664 E 5720 S
- 5536 Springtree Ln Unit A
- 537 E Edindrew Dr
- 5667 Adaley Ave
- 5673 Adaley Ave
- 5661 Adaley Ave
- 5673 S Adaley Ave
- 5666 Adaley Ave
- 5658 Adaley Ave
- 5655 Adaley Ave
- 5674 Adaley Ave
- 5674 S Adaley Ave
- 483 Crown Ridge Rd
- 483 E Crown Ridge Rd
- 484 Crown Ridge Cir
- 484 E Crown Ridge Cir
- 5687 Adaley Ave
- 5687 S Adaley Ave
- 5653 S Adaley Ave
- 5682 Adaley Ave
- 5653 Adaley Ave
- 450 Adaley Ave
- 455 Adaley Ave