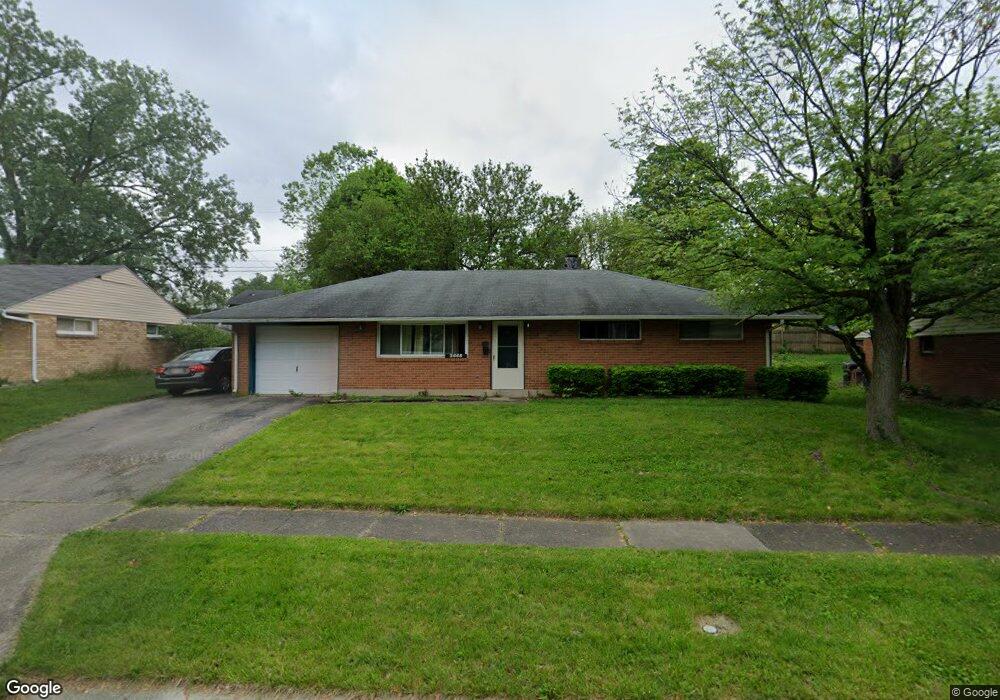
5668 Moorefield Dr Dayton, OH 45424
Estimated Value: $163,000 - $201,000
3
Beds
2
Baths
1,080
Sq Ft
$163/Sq Ft
Est. Value
About This Home
This home is located at 5668 Moorefield Dr, Dayton, OH 45424 and is currently estimated at $176,270, approximately $163 per square foot. 5668 Moorefield Dr is a home located in Montgomery County with nearby schools including Wayne High School and Huber Heights Christian Academy.
Ownership History
Date
Name
Owned For
Owner Type
Purchase Details
Closed on
May 16, 2023
Sold by
Ferralli Samuel A and Ferralli Diana M
Bought by
Naracs Enterprises Llc
Current Estimated Value
Purchase Details
Closed on
Apr 12, 2005
Sold by
Abn Amro Mortgage Group Inc
Bought by
Ferralli Samuel A and Ferralli Diana M
Purchase Details
Closed on
Aug 31, 2004
Sold by
White Paul and White Joellen
Bought by
Abn Amro Mortgage Group Inc
Purchase Details
Closed on
Jun 28, 2002
Sold by
Gilley Richard L and Gilley Carolyn
Bought by
White Paul and White Joellen
Home Financials for this Owner
Home Financials are based on the most recent Mortgage that was taken out on this home.
Original Mortgage
$83,242
Interest Rate
6.63%
Mortgage Type
FHA
Purchase Details
Closed on
May 31, 1996
Sold by
Huber Investment Corp
Bought by
Garrett Duane A and Garrett Bobbi J
Purchase Details
Closed on
May 14, 1996
Sold by
Huber Investment Corp
Bought by
Gilley Richard L
Create a Home Valuation Report for This Property
The Home Valuation Report is an in-depth analysis detailing your home's value as well as a comparison with similar homes in the area
Home Values in the Area
Average Home Value in this Area
Purchase History
| Date | Buyer | Sale Price | Title Company |
|---|---|---|---|
| Naracs Enterprises Llc | -- | None Listed On Document | |
| Ferralli Samuel A | $74,500 | Resource Title Agency Inc | |
| Abn Amro Mortgage Group Inc | $70,000 | None Available | |
| White Paul | $83,900 | -- | |
| Garrett Duane A | $108,900 | -- | |
| Gilley Richard L | $61,900 | -- |
Source: Public Records
Mortgage History
| Date | Status | Borrower | Loan Amount |
|---|---|---|---|
| Previous Owner | White Paul | $83,242 |
Source: Public Records
Tax History Compared to Growth
Tax History
| Year | Tax Paid | Tax Assessment Tax Assessment Total Assessment is a certain percentage of the fair market value that is determined by local assessors to be the total taxable value of land and additions on the property. | Land | Improvement |
|---|---|---|---|---|
| 2024 | $2,263 | $42,580 | $10,010 | $32,570 |
| 2023 | $2,263 | $42,580 | $10,010 | $32,570 |
| 2022 | $2,001 | $29,750 | $7,000 | $22,750 |
| 2021 | $2,036 | $29,750 | $7,000 | $22,750 |
| 2020 | $2,037 | $29,750 | $7,000 | $22,750 |
| 2019 | $2,076 | $25,660 | $7,000 | $18,660 |
| 2018 | $2,083 | $25,660 | $7,000 | $18,660 |
| 2017 | $2,071 | $25,660 | $7,000 | $18,660 |
| 2016 | $1,986 | $23,920 | $7,000 | $16,920 |
| 2015 | $1,875 | $23,920 | $7,000 | $16,920 |
| 2014 | $1,875 | $23,920 | $7,000 | $16,920 |
| 2012 | -- | $26,260 | $8,750 | $17,510 |
Source: Public Records
Map
Nearby Homes
- 5625 Copley Cir
- 6109 Ansbury Dr
- 5488 Flotron Dr
- 5926 Chambersburg Rd
- 5455 Flotron Dr
- 6100 Farmborough Dr
- 5159 Fishburg Rd
- 5248 Tilbury Rd
- 6673 Celestine St
- 5983 Harshmanville Rd
- 6529 Harshmanville Rd
- 5004 Fishburg Rd
- 5952 Tibet Dr
- 6413 Alter Rd
- 5912 Bavaria Place
- 6800 Cicero Ct
- 5848 Tomberg St
- 5080 Tilbury Rd
- 5630 Botkins Rd
- 4848 Rittenhouse Dr
- 5680 Moorefield Dr
- 5656 Moorefield Dr
- 5557 Storck Dr
- 5549 Storck Dr
- 5565 Storck Dr
- 5692 Moorefield Dr
- 5644 Moorefield Dr
- 5673 Moorefield Dr
- 5541 Storck Dr
- 5573 Storck Dr
- 5685 Moorefield Dr
- 5655 Moorefield Dr
- 5533 Storck Dr
- 5632 Moorefield Dr
- 5641 Moorefield Dr
- 5581 Storck Dr
- 5720 Moorefield Dr
- 5624 Copley Cir
- 5554 Storck Dr
- 5560 Storck Dr