Estimated Value: $276,163 - $292,000
2
Beds
2
Baths
1,376
Sq Ft
$206/Sq Ft
Est. Value
About This Home
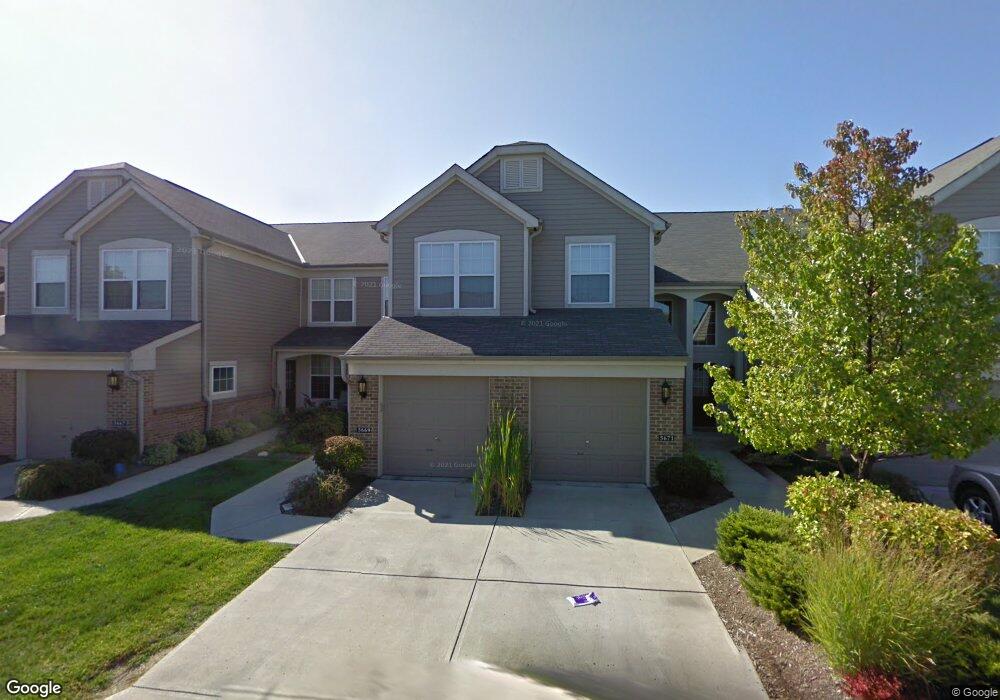
This home is located at 5669 Dockside Dr, Mason, OH 45040 and is currently estimated at $283,291, approximately $205 per square foot. 5669 Dockside Dr is a home located in Warren County with nearby schools including Mason Intermediate Elementary School, Mason Middle School, and William Mason High School.
Ownership History
Date
Name
Owned For
Owner Type
Purchase Details
Closed on
Nov 13, 2020
Sold by
Parmar Bhavesh Kantilal
Bought by
Bhavya Properties Llc
Current Estimated Value
Home Financials for this Owner
Home Financials are based on the most recent Mortgage that was taken out on this home.
Original Mortgage
$116,400
Outstanding Balance
$102,354
Interest Rate
2.9%
Mortgage Type
New Conventional
Estimated Equity
$180,937
Purchase Details
Closed on
Oct 7, 2020
Sold by
Bhavya Properties Llc
Bought by
Parmar Bhavesh Kantilal
Home Financials for this Owner
Home Financials are based on the most recent Mortgage that was taken out on this home.
Original Mortgage
$116,400
Outstanding Balance
$102,354
Interest Rate
2.9%
Mortgage Type
New Conventional
Estimated Equity
$180,937
Purchase Details
Closed on
Oct 25, 2018
Sold by
Parmar Bhavesh and Parmar Deepali
Bought by
Bhavya Properties Llc
Purchase Details
Closed on
Sep 23, 2002
Sold by
Grand Comm Ltd
Bought by
Fischer Att Homes Ltd
Create a Home Valuation Report for This Property
The Home Valuation Report is an in-depth analysis detailing your home's value as well as a comparison with similar homes in the area
Home Values in the Area
Average Home Value in this Area
Purchase History
| Date | Buyer | Sale Price | Title Company |
|---|---|---|---|
| Bhavya Properties Llc | -- | Rivertowne Title Llc | |
| Parmar Bhavesh Kantilal | -- | None Available | |
| Bhavya Properties Llc | -- | Rivertowne Title Llc | |
| Fischer Att Homes Ltd | $199,800 | -- |
Source: Public Records
Mortgage History
| Date | Status | Borrower | Loan Amount |
|---|---|---|---|
| Open | Parmar Bhavesh Kantilal | $116,400 |
Source: Public Records
Tax History
| Year | Tax Paid | Tax Assessment Tax Assessment Total Assessment is a certain percentage of the fair market value that is determined by local assessors to be the total taxable value of land and additions on the property. | Land | Improvement |
|---|---|---|---|---|
| 2025 | $3,347 | $76,870 | $21,000 | $55,870 |
| 2024 | $3,347 | $76,870 | $21,000 | $55,870 |
| 2023 | $3,026 | $58,306 | $8,610 | $49,696 |
| 2022 | $3,026 | $58,307 | $8,610 | $49,697 |
| 2021 | $2,876 | $58,307 | $8,610 | $49,697 |
| 2020 | $2,761 | $47,404 | $7,000 | $40,404 |
| 2019 | $2,563 | $47,404 | $7,000 | $40,404 |
| 2018 | $2,503 | $47,404 | $7,000 | $40,404 |
| 2017 | $2,279 | $39,813 | $6,332 | $33,481 |
| 2016 | $2,343 | $39,813 | $6,332 | $33,481 |
| 2015 | $2,349 | $39,813 | $6,332 | $33,481 |
| 2014 | $2,377 | $37,210 | $5,920 | $31,290 |
| 2013 | $2,382 | $44,010 | $7,000 | $37,010 |
Source: Public Records
Map
Nearby Homes
- 5369 N Shore Place
- 6266 Trailwood Ct
- 6304 Trailwood Ct
- 5576 Winding Cape Way
- 5673 Melbury Ct
- 5641 Melbury Ct
- 6285 Greenwood Ct
- 6315 Greenwood Ct
- 4796 White Blossom Blvd
- 9018 Boylston St
- 6713 Quail Lake
- 6589 Quail Lake
- 8588 Charleston Creek Dr
- 9024 Beacon St
- 9240 Beacon St
- 9246 Beacon St
- 7064 Celebration Way
- 7076 Celebration Way
- 7080 Celebration Way
- 7103 Celebration Way
- 5669 Dockside Dr
- 5671 Dockside Dr Unit 8303
- 5671 Dockside Dr
- 5667 Dockside Dr
- 5667 Dockside Dr
- 5675 Dockside Dr Unit 8204
- 5675 Dockside Dr
- 5673 Dockside Dr
- 5665 Dockside Dr
- 5665 Dockside Dr
- 5661 Dockside Dr
- 5663 Dockside Dr
- 5663 Dockside Dr
- 5661 Harbourside Dr Unit 104
- 5661 Harbourside Dr Unit G246
- 5655 Harbourside Dr Unit 103
- 5655 Harbourside Dr
- 5651 Harbourside Dr Unit 102
- 5651 Harbourside Dr
- 5647 Harbourside Dr Unit 101
Your Personal Tour Guide
Ask me questions while you tour the home.