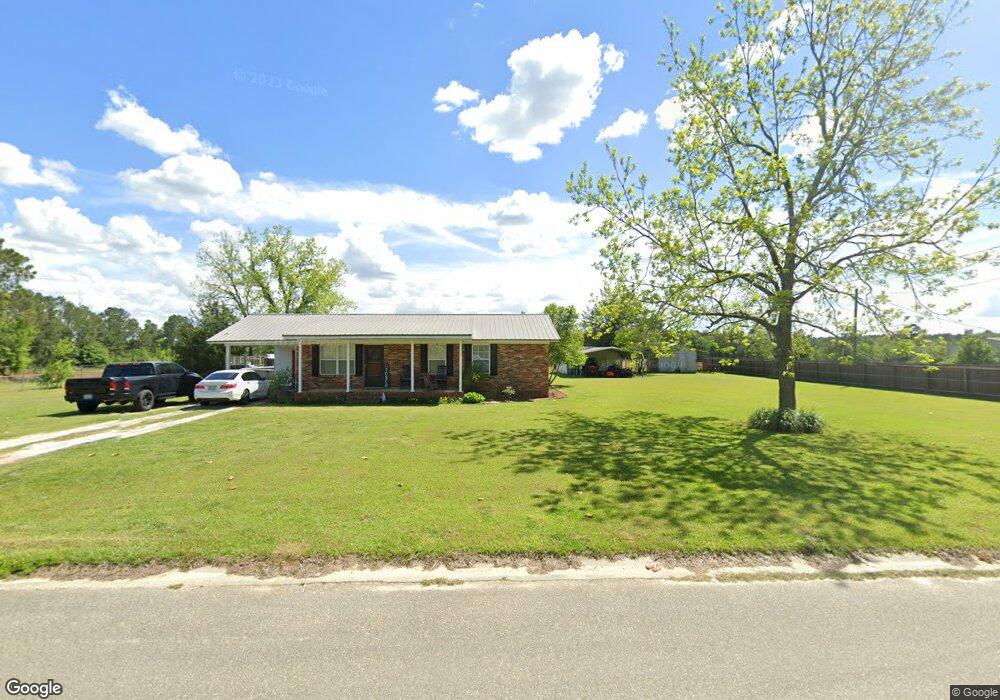
567 Clarence Jones Rd Moultrie, GA 31768
Estimated Value: $97,000 - $117,000
--
Bed
1
Bath
975
Sq Ft
$110/Sq Ft
Est. Value
About This Home
This home is located at 567 Clarence Jones Rd, Moultrie, GA 31768 and is currently estimated at $107,001, approximately $109 per square foot. 567 Clarence Jones Rd is a home located in Colquitt County with nearby schools including Okapilco Elementary School, C.A. Gray Junior High School, and Willie J. Williams Middle School.
Ownership History
Date
Name
Owned For
Owner Type
Purchase Details
Closed on
Jun 20, 2025
Sold by
Carter Donald Michael
Bought by
Carter Nikki Leigh
Current Estimated Value
Purchase Details
Closed on
Jan 13, 2017
Sold by
Franklin Tommy
Bought by
Carter Donald Michael
Home Financials for this Owner
Home Financials are based on the most recent Mortgage that was taken out on this home.
Original Mortgage
$41,859
Interest Rate
4.16%
Mortgage Type
Purchase Money Mortgage
Purchase Details
Closed on
Nov 30, 2011
Sold by
Shepard Phillip Harold
Bought by
Ogletree Tommy Franklin
Home Financials for this Owner
Home Financials are based on the most recent Mortgage that was taken out on this home.
Original Mortgage
$46,299
Interest Rate
4.06%
Mortgage Type
New Conventional
Purchase Details
Closed on
Oct 24, 2011
Sold by
Boyd Shirley A
Bought by
Hoechat Stephanie Boyd and Shepard Phillip Harold
Home Financials for this Owner
Home Financials are based on the most recent Mortgage that was taken out on this home.
Original Mortgage
$46,299
Interest Rate
4.06%
Mortgage Type
New Conventional
Create a Home Valuation Report for This Property
The Home Valuation Report is an in-depth analysis detailing your home's value as well as a comparison with similar homes in the area
Home Values in the Area
Average Home Value in this Area
Purchase History
| Date | Buyer | Sale Price | Title Company |
|---|---|---|---|
| Carter Nikki Leigh | -- | -- | |
| Carter Donald Michael | $40,200 | -- | |
| Ogletree Tommy Franklin | $48,000 | -- | |
| Hoechat Stephanie Boyd | -- | -- |
Source: Public Records
Mortgage History
| Date | Status | Borrower | Loan Amount |
|---|---|---|---|
| Previous Owner | Carter Donald Michael | $41,859 | |
| Previous Owner | Ogletree Tommy Franklin | $46,299 |
Source: Public Records
Tax History Compared to Growth
Tax History
| Year | Tax Paid | Tax Assessment Tax Assessment Total Assessment is a certain percentage of the fair market value that is determined by local assessors to be the total taxable value of land and additions on the property. | Land | Improvement |
|---|---|---|---|---|
| 2024 | $796 | $34,259 | $1,883 | $32,376 |
| 2023 | $722 | $27,467 | $1,883 | $25,584 |
| 2022 | $591 | $24,820 | $1,674 | $23,146 |
| 2021 | $517 | $21,280 | $1,674 | $19,606 |
| 2020 | $492 | $19,906 | $1,674 | $18,232 |
| 2019 | $522 | $18,990 | $1,674 | $17,316 |
| 2018 | $486 | $18,990 | $1,674 | $17,316 |
| 2017 | $543 | $19,961 | $2,652 | $17,309 |
| 2016 | $550 | $19,961 | $2,652 | $17,309 |
| 2015 | $556 | $19,961 | $2,652 | $17,309 |
| 2014 | -- | $19,961 | $2,652 | $17,309 |
| 2013 | -- | $19,961 | $2,652 | $17,308 |
Source: Public Records
Map
Nearby Homes
- 218 Gusty Rd
- 178 Cool Breeze Dr
- 3233 Sylvester Dr
- 514 Indian Lake Dr
- 131 Seminole Dr
- 107 30th Ave NW
- 441 Cherokee Dr
- 273 Seminole Dr
- 15,23,27 29th Ave NW
- 378 Old S R 33
- 210 Arrowhead Dr
- 102 Schley Church Rd
- 209 Cherokee Dr
- 0 S U Highway 319 N
- 1208 Maple St
- 0 Doc Darbyshire Rd
- 722 Martin Luther King jr Dr
- 615 1st St NW
- 316 5th Ave NW
- 503 2nd St NW
- 585 Clarence Jones Rd
- 568 Clarence Jones Rd
- 545 Clarence Jones Rd
- 546 Clarence Jones Rd
- 542 Clarence Jones Rd Unit 1
- 542 Clarence Jones Rd
- 626 Clarence Jones Rd
- 527 Clarence Jones Rd
- 530 Clarence Jones Rd
- 597 Clarence Jones Rd
- 526 Clarence Jones Rd
- 534 Clarence Jones Rd
- 642 Clarence Jones Rd
- 557 Clarence Jones Rd
- 458 Clarence Jones Rd
- 440 Clarence Jones Rd
- 603 Clarence Jones Rd
- 420 Clarence Jones Rd
- 607 Clarence Jones Rd
- 687 Clarence Jones Rd