567 Crosby St Akron, OH 44302
West Hill NeighborhoodEstimated Value: $135,000 - $192,000
3
Beds
3
Baths
1,768
Sq Ft
$89/Sq Ft
Est. Value
About This Home
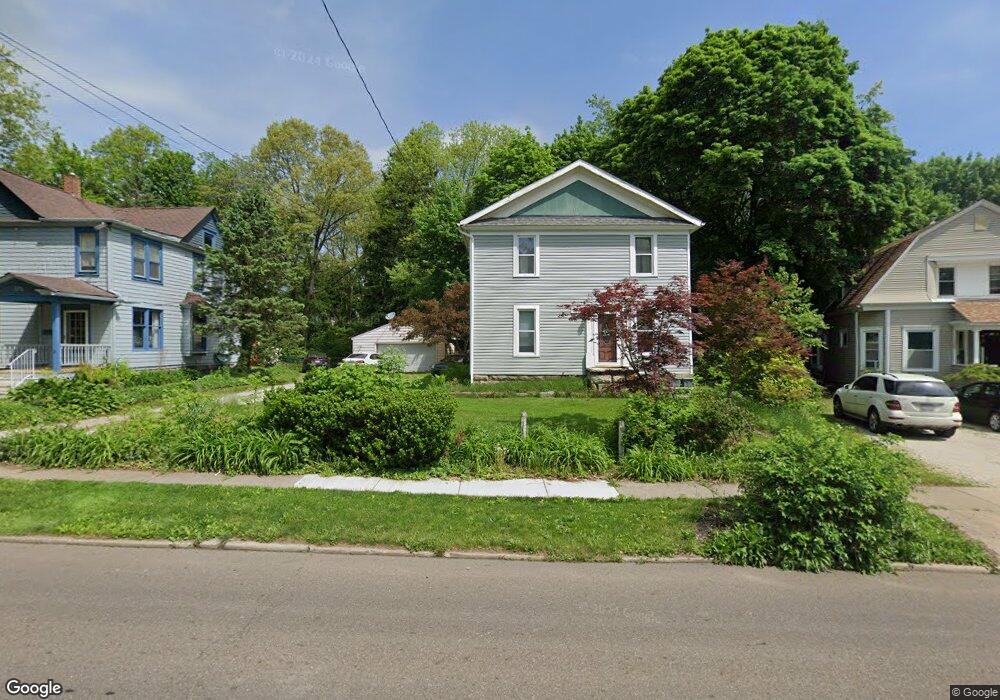
This home is located at 567 Crosby St, Akron, OH 44302 and is currently estimated at $157,484, approximately $89 per square foot. 567 Crosby St is a home located in Summit County with nearby schools including Towpath Trail High School, St. Vincent Elementary School, and Our Lady Of The Elms Elementary School.
Ownership History
Date
Name
Owned For
Owner Type
Purchase Details
Closed on
Nov 2, 2020
Sold by
Given Not
Bought by
Belcher-Diller Glenda
Current Estimated Value
Purchase Details
Closed on
Oct 14, 2020
Sold by
Glenda Belcher-Diller and French Glenda B
Bought by
Belcher-Diller Glenda
Purchase Details
Closed on
Aug 24, 1995
Sold by
Snyder Elsie O
Bought by
French Glenda B
Home Financials for this Owner
Home Financials are based on the most recent Mortgage that was taken out on this home.
Original Mortgage
$22,500
Interest Rate
7.43%
Mortgage Type
New Conventional
Create a Home Valuation Report for This Property
The Home Valuation Report is an in-depth analysis detailing your home's value as well as a comparison with similar homes in the area
Home Values in the Area
Average Home Value in this Area
Purchase History
| Date | Buyer | Sale Price | Title Company |
|---|---|---|---|
| Belcher-Diller Glenda | -- | -- | |
| Belcher-Diller Glenda | -- | Durr Susan L | |
| French Glenda B | $68,000 | -- |
Source: Public Records
Mortgage History
| Date | Status | Borrower | Loan Amount |
|---|---|---|---|
| Previous Owner | French Glenda B | $22,500 |
Source: Public Records
Tax History Compared to Growth
Tax History
| Year | Tax Paid | Tax Assessment Tax Assessment Total Assessment is a certain percentage of the fair market value that is determined by local assessors to be the total taxable value of land and additions on the property. | Land | Improvement |
|---|---|---|---|---|
| 2025 | $1,392 | $33,887 | $10,080 | $23,807 |
| 2024 | $1,380 | $33,887 | $10,080 | $23,807 |
| 2023 | $1,392 | $33,887 | $10,080 | $23,807 |
| 2022 | $843 | $19,933 | $5,929 | $14,004 |
| 2021 | $844 | $19,933 | $5,929 | $14,004 |
| 2020 | $832 | $19,930 | $5,930 | $14,000 |
| 2019 | $877 | $19,550 | $6,990 | $12,560 |
| 2018 | $866 | $19,550 | $6,990 | $12,560 |
| 2017 | $879 | $19,550 | $6,990 | $12,560 |
| 2016 | $879 | $19,550 | $6,990 | $12,560 |
| 2015 | $879 | $19,550 | $6,990 | $12,560 |
| 2014 | $872 | $19,550 | $6,990 | $12,560 |
| 2013 | $918 | $20,440 | $6,990 | $13,450 |
Source: Public Records
Map
Nearby Homes