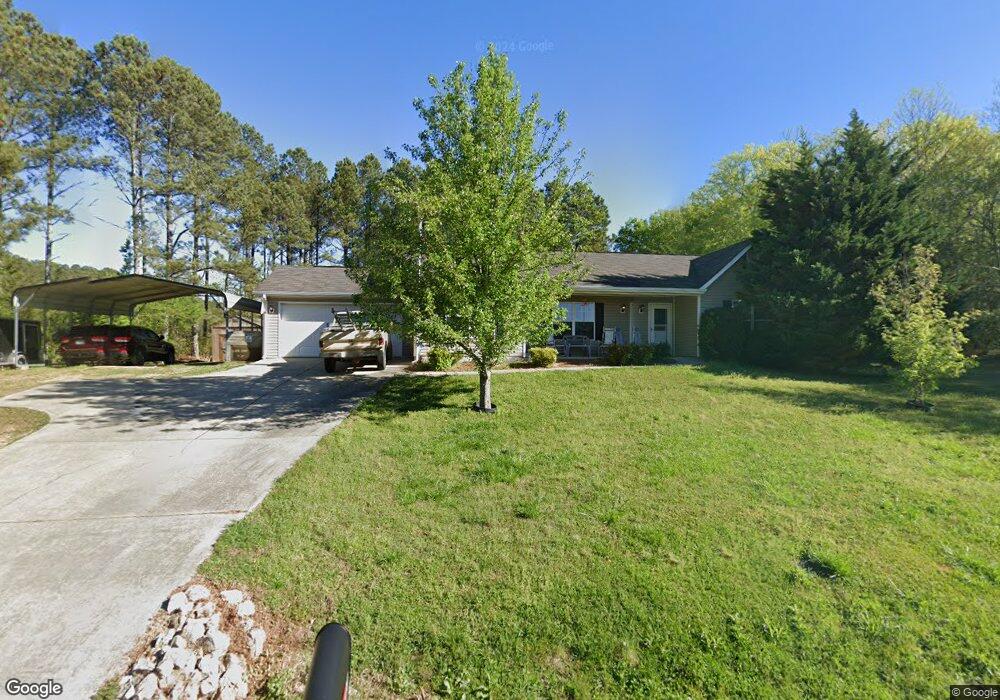
567 Dunn Rd SE Silver Creek, GA 30173
Estimated Value: $267,261 - $316,000
4
Beds
2
Baths
1,608
Sq Ft
$180/Sq Ft
Est. Value
About This Home
This home is located at 567 Dunn Rd SE, Silver Creek, GA 30173 and is currently estimated at $289,315, approximately $179 per square foot. 567 Dunn Rd SE is a home located in Polk County with nearby schools including Vineyard Harvester Christian Academy.
Ownership History
Date
Name
Owned For
Owner Type
Purchase Details
Closed on
May 5, 2017
Sold by
Olds Robyn A
Bought by
Russell Woodward
Current Estimated Value
Home Financials for this Owner
Home Financials are based on the most recent Mortgage that was taken out on this home.
Original Mortgage
$120,000
Outstanding Balance
$81,512
Interest Rate
4.1%
Mortgage Type
VA
Estimated Equity
$207,803
Purchase Details
Closed on
May 7, 2010
Sold by
J K Rentals Ltd
Bought by
Olds Robyn Ann
Home Financials for this Owner
Home Financials are based on the most recent Mortgage that was taken out on this home.
Original Mortgage
$94,724
Interest Rate
5.37%
Mortgage Type
FHA
Purchase Details
Closed on
Apr 10, 2007
Sold by
Holsey Dwight
Bought by
J K Rentals Ltd
Purchase Details
Closed on
Mar 16, 2007
Sold by
Wells Gertrude M
Bought by
Holsey Dwight
Purchase Details
Closed on
Jun 25, 1996
Sold by
King Betty
Bought by
Wells Gertrude M
Create a Home Valuation Report for This Property
The Home Valuation Report is an in-depth analysis detailing your home's value as well as a comparison with similar homes in the area
Home Values in the Area
Average Home Value in this Area
Purchase History
| Date | Buyer | Sale Price | Title Company |
|---|---|---|---|
| Russell Woodward | $120,000 | -- | |
| Olds Robyn Ann | $96,000 | -- | |
| J K Rentals Ltd | $8,500 | -- | |
| Holsey Dwight | $3,000 | -- | |
| Wells Gertrude M | $1,300 | -- |
Source: Public Records
Mortgage History
| Date | Status | Borrower | Loan Amount |
|---|---|---|---|
| Open | Russell Woodward | $120,000 | |
| Previous Owner | Olds Robyn Ann | $94,724 |
Source: Public Records
Tax History Compared to Growth
Tax History
| Year | Tax Paid | Tax Assessment Tax Assessment Total Assessment is a certain percentage of the fair market value that is determined by local assessors to be the total taxable value of land and additions on the property. | Land | Improvement |
|---|---|---|---|---|
| 2024 | -- | $95,070 | $2,308 | $92,762 |
| 2023 | $0 | $61,490 | $2,308 | $59,182 |
| 2022 | $1,257 | $52,307 | $1,538 | $50,769 |
| 2021 | $1,257 | $52,307 | $1,538 | $50,769 |
| 2020 | $1,423 | $52,307 | $1,538 | $50,769 |
| 2019 | $1,212 | $44,527 | $1,538 | $42,989 |
| 2018 | $1,131 | $41,578 | $1,538 | $40,040 |
| 2017 | $1,109 | $40,765 | $1,538 | $39,227 |
| 2016 | $1,127 | $41,427 | $2,200 | $39,227 |
| 2015 | $1,138 | $41,698 | $2,200 | $39,498 |
| 2014 | $1,146 | $41,698 | $2,200 | $39,498 |
Source: Public Records
Map
Nearby Homes
- 0 Colquitt Rd Unit 25175705
- 0 Colquitt Rd Unit 7661475
- 0 Colquitt Rd Unit 10623944
- 573 Relay Rd SE
- 2129 Lake Creek Rd
- 110 Mulberry Ln
- 1170 Lake Creek Rd
- TRACT4 Drummond Rd
- 0 Stewart Rd
- Tract2 Drummond Rd
- 565 Raiford Rd
- 31 Meadow Lakes Terrace
- 2705 Collard Valley Rd
- 2944 Old Collard Valley Rd
- 231 Gordon Rd
- 1104 Burkhalter Rd SE
- 0 Benefield Rd Unit 7479734
- 0 Benefield Rd Unit 10405501
- 0 Richard Pullen Rd Unit 10577442
- 0 Richard Pullen Rd Unit 7626794
- 528 Dunn Rd SE
- 486 Dunn Rd SE
- 643 Dunn Rd SE
- 696 Puckett Rd SE
- 742 Puckett Rd SE
- 432 Dunn Rd SE
- 699 Dunn Rd SE
- 431 Dunn Rd SE
- 752 Puckett Rd SE
- 336 Pleasant View Rd
- 701 Puckett Rd SE
- 772 Puckett Rd SE
- 0 Pleasant View Rd Unit 8899738
- 0 Pleasant View Rd Unit 7253853
- 356 Dunn Rd SE
- 340 Pleasant View Rd
- 335 Dunn Rd SE
- 749 Dunn Rd SE
- 311 Dunn Rd SE
- 329 Dunn Rd SE