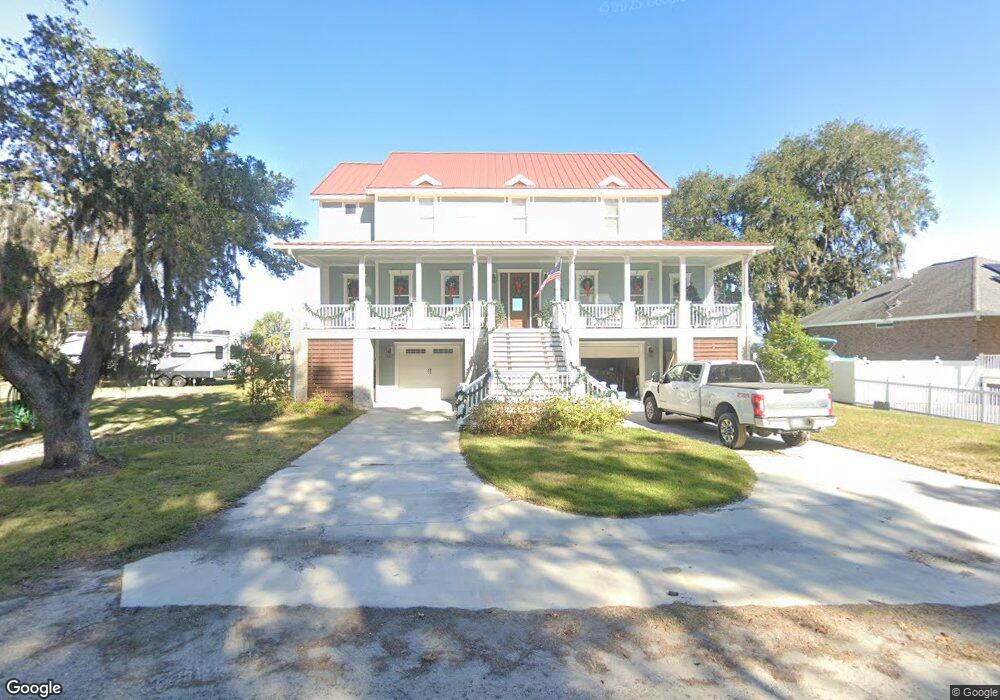
567 E 1st St Midway, GA 31320
Estimated Value: $769,000 - $917,626
4
Beds
4
Baths
3,702
Sq Ft
$233/Sq Ft
Est. Value
About This Home
This home is located at 567 E 1st St, Midway, GA 31320 and is currently estimated at $860,875, approximately $232 per square foot. 567 E 1st St is a home with nearby schools including Liberty Elementary School, Midway Middle School, and Liberty County High School.
Ownership History
Date
Name
Owned For
Owner Type
Purchase Details
Closed on
May 13, 2025
Sold by
Tyson Debra Rene
Bought by
Tyson Debra Rene Tr and Tyson Donnie William Jr Tr
Current Estimated Value
Purchase Details
Closed on
Nov 21, 2018
Sold by
Tyson Donnie W
Bought by
Tyson Donnie William and Tyson Debra Rene
Purchase Details
Closed on
Jan 21, 2011
Sold by
Tyson & Sons Inc
Bought by
Tyson Donnie W
Purchase Details
Closed on
May 4, 2005
Sold by
Utley Charles R
Bought by
Tyson & Sons Inc
Home Financials for this Owner
Home Financials are based on the most recent Mortgage that was taken out on this home.
Original Mortgage
$194,031
Interest Rate
5.88%
Mortgage Type
Purchase Money Mortgage
Purchase Details
Closed on
Mar 27, 2002
Sold by
Utley Charles R and Utley Shirley
Bought by
Utley Charles R and Utley Shirley
Purchase Details
Closed on
Mar 27, 2001
Bought by
Utley Charles R and Utley Shirley
Create a Home Valuation Report for This Property
The Home Valuation Report is an in-depth analysis detailing your home's value as well as a comparison with similar homes in the area
Purchase History
| Date | Buyer | Sale Price | Title Company |
|---|---|---|---|
| Tyson Debra Rene Tr | -- | -- | |
| Tyson Donnie William | -- | -- | |
| Tyson Donnie W | -- | -- | |
| Tyson & Sons Inc | $60,000 | -- | |
| Utley Charles R | -- | -- | |
| Utley Charles R | -- | -- |
Source: Public Records
Mortgage History
| Date | Status | Borrower | Loan Amount |
|---|---|---|---|
| Previous Owner | Tyson & Sons Inc | $194,031 |
Source: Public Records
Tax History
| Year | Tax Paid | Tax Assessment Tax Assessment Total Assessment is a certain percentage of the fair market value that is determined by local assessors to be the total taxable value of land and additions on the property. | Land | Improvement |
|---|---|---|---|---|
| 2025 | $9,783 | $349,617 | $94,752 | $254,865 |
| 2024 | $9,783 | $373,874 | $43,200 | $330,674 |
| 2023 | $9,547 | $331,338 | $43,200 | $288,138 |
| 2022 | $8,385 | $281,519 | $43,200 | $238,319 |
| 2021 | $8,703 | $222,426 | $32,400 | $190,026 |
| 2020 | $1,533 | $39,813 | $32,400 | $7,413 |
| 2019 | $1,453 | $38,748 | $32,400 | $6,348 |
| 2018 | $1,444 | $38,990 | $32,400 | $6,590 |
| 2017 | $1,166 | $35,423 | $28,591 | $6,832 |
| 2016 | $1,246 | $36,148 | $28,591 | $7,556 |
| 2015 | $1,119 | $36,148 | $28,591 | $7,556 |
| 2014 | $1,119 | $32,129 | $24,648 | $7,481 |
| 2013 | -- | $41,177 | $21,150 | $20,026 |
Source: Public Records
Map
Nearby Homes
- 3194 Isle of Wight Rd
- 3182 Isle of Wight Rd
- 182 Priscilla Dr
- 194 Priscilla Dr
- 777 E 1st St
- LOTS 14,15 & 16 E Poncell Dr
- 243 E 1st St
- Lots 76 and 77 Clark St
- 353 Main St
- 4 Rd
- 48 Carlyene Dr
- 98 Carlyene Dr
- 191 Island Dr
- 46 Laughing Gull Hideaway Dr
- Lot 46 Laughing Gull Hideaway Dr
- Lot 26 Jerico Marsh Rd
- Lot 25 Jerico Marsh Rd
- 181 Pineland Rd
- 62 Pineland Rd
- 321 Carlyene Dr
- 543 E 1st St
- 535 E 1st St
- 511 E 1st St
- 576 E 1st St
- 470 E 1st St
- 540 E 1st St
- 580 E 1st St
- 23 Priscilla Dr
- 471 E 1st St
- 480 E 1st St
- 53 Priscilla Dr
- 659 E 1st St
- 0 Priscilla Dr Unit SA222784
- 0 Priscilla Dr Unit 39775
- 0 Priscilla Dr Unit 30015
- 0 Priscilla Dr Unit 29537
- 0 Priscilla Dr Unit 147646
- 0 Priscilla Dr Unit 288629
- 0 Priscilla Dr Unit 133538
- 0 Priscilla Dr
Your Personal Tour Guide
Ask me questions while you tour the home.