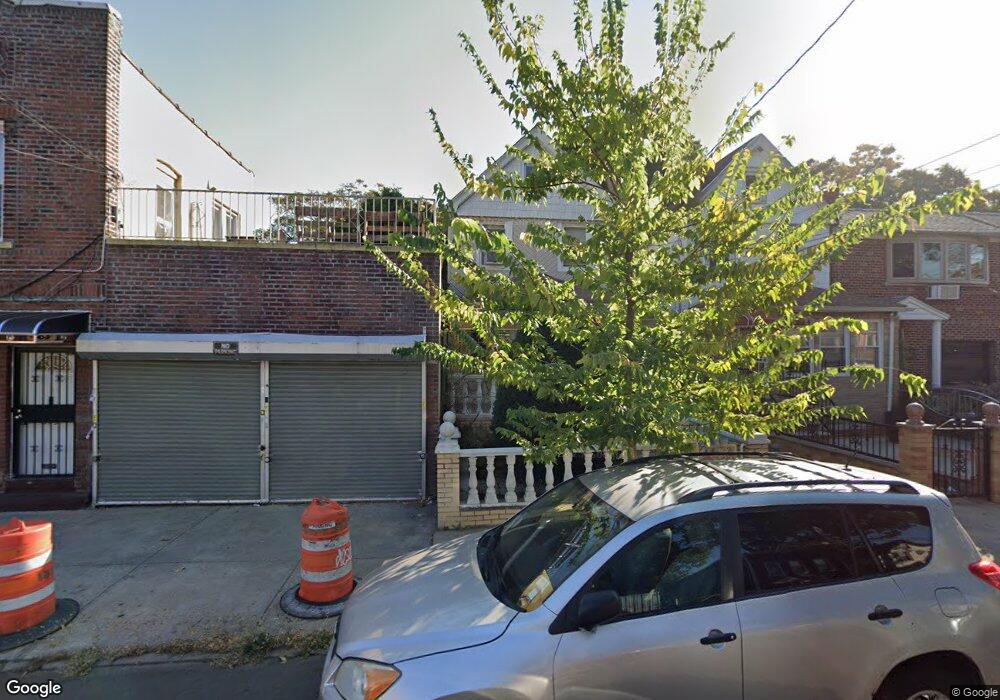
567 E 43rd St Brooklyn, NY 11203
East Flatbush NeighborhoodEstimated Value: $618,000 - $767,000
Studio
--
Bath
1,280
Sq Ft
$525/Sq Ft
Est. Value
About This Home
This home is located at 567 E 43rd St, Brooklyn, NY 11203 and is currently estimated at $671,457, approximately $524 per square foot. 567 E 43rd St is a home located in Kings County with nearby schools including P.S. 109, Andries Hudde School, and Central Brooklyn Ascend Charter.
Ownership History
Date
Name
Owned For
Owner Type
Purchase Details
Closed on
Mar 25, 1999
Sold by
Edwards Alfonso
Bought by
Stapleton Glema and Edwards Tamara
Current Estimated Value
Create a Home Valuation Report for This Property
The Home Valuation Report is an in-depth analysis detailing your home's value as well as a comparison with similar homes in the area
Home Values in the Area
Average Home Value in this Area
Purchase History
| Date | Buyer | Sale Price | Title Company |
|---|---|---|---|
| Stapleton Glema | -- | Stewart Title Insurance Co | |
| Stapleton Glema | -- | Stewart Title Insurance Co |
Source: Public Records
Tax History Compared to Growth
Tax History
| Year | Tax Paid | Tax Assessment Tax Assessment Total Assessment is a certain percentage of the fair market value that is determined by local assessors to be the total taxable value of land and additions on the property. | Land | Improvement |
|---|---|---|---|---|
| 2025 | $5,050 | $46,260 | $12,420 | $33,840 |
| 2024 | $5,050 | $40,500 | $12,420 | $28,080 |
| 2023 | $5,054 | $42,180 | $12,420 | $29,760 |
| 2022 | $4,967 | $35,580 | $12,420 | $23,160 |
| 2021 | $4,954 | $35,400 | $12,420 | $22,980 |
| 2019 | $4,383 | $27,780 | $12,420 | $15,360 |
| 2018 | $4,227 | $20,736 | $7,388 | $13,348 |
| 2017 | $4,227 | $20,736 | $8,942 | $11,794 |
| 2016 | $3,922 | $19,617 | $10,002 | $9,615 |
| 2015 | $2,490 | $18,507 | $12,196 | $6,311 |
| 2014 | $2,490 | $17,460 | $13,800 | $3,660 |
Source: Public Records
Map
Nearby Homes