Estimated Value: $170,867 - $236,000
4
Beds
1
Bath
2,044
Sq Ft
$98/Sq Ft
Est. Value
About This Home
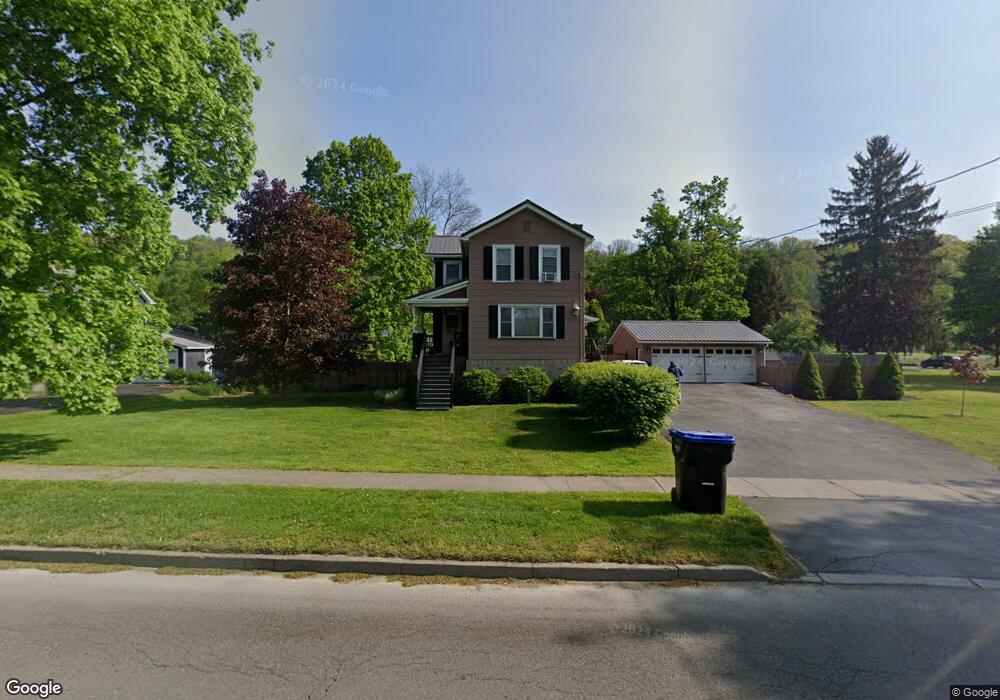
This home is located at 567 E Front St, Owego, NY 13827 and is currently estimated at $200,217, approximately $97 per square foot. 567 E Front St is a home located in Tioga County with nearby schools including Owego Elementary School, Owego-Apalachin Middle School, and Owego Free Academy.
Ownership History
Date
Name
Owned For
Owner Type
Purchase Details
Closed on
Aug 10, 2007
Sold by
Merrin Nancy J
Bought by
Henson Kenneth F
Current Estimated Value
Home Financials for this Owner
Home Financials are based on the most recent Mortgage that was taken out on this home.
Original Mortgage
$98,212
Interest Rate
6.65%
Mortgage Type
Purchase Money Mortgage
Purchase Details
Closed on
Sep 16, 2002
Sold by
Shepardson Allene
Bought by
Merrin Nancy J
Create a Home Valuation Report for This Property
The Home Valuation Report is an in-depth analysis detailing your home's value as well as a comparison with similar homes in the area
Home Values in the Area
Average Home Value in this Area
Purchase History
| Date | Buyer | Sale Price | Title Company |
|---|---|---|---|
| Henson Kenneth F | $101,250 | Frederick Hander | |
| Merrin Nancy J | $61,500 | Richard A Barber |
Source: Public Records
Mortgage History
| Date | Status | Borrower | Loan Amount |
|---|---|---|---|
| Previous Owner | Henson Kenneth F | $98,212 |
Source: Public Records
Tax History
| Year | Tax Paid | Tax Assessment Tax Assessment Total Assessment is a certain percentage of the fair market value that is determined by local assessors to be the total taxable value of land and additions on the property. | Land | Improvement |
|---|---|---|---|---|
| 2024 | $4,147 | $64,800 | $11,800 | $53,000 |
| 2023 | $28 | $64,800 | $11,800 | $53,000 |
| 2022 | $2,854 | $64,800 | $11,800 | $53,000 |
| 2021 | $2,245 | $64,800 | $11,800 | $53,000 |
| 2020 | $2,171 | $64,800 | $11,800 | $53,000 |
| 2019 | $1,268 | $64,800 | $11,800 | $53,000 |
| 2018 | $3,283 | $64,800 | $11,800 | $53,000 |
| 2017 | $3,235 | $64,800 | $11,800 | $53,000 |
| 2016 | $3,229 | $64,800 | $11,800 | $53,000 |
| 2015 | -- | $50,000 | $11,800 | $38,200 |
| 2014 | -- | $50,000 | $11,800 | $38,200 |
Source: Public Records
Map
Nearby Homes
- 499 E Front St
- 2145 Lisle Rd Unit Lot H
- 2145 Lisle Rd Unit Lot K
- 2145 Lisle Rd Unit Lot I
- 2145 Lisle Rd Unit Lot G
- 2145 Lisle Rd Unit Lot A
- 32 John St
- 273 Erie St
- 359 Main St
- 9 King Point Cir S
- 322 Front St
- 4 Courtly Cir
- 00 Sunnyside Dr S
- 0 Sunnyside Dr S
- 67-69 Paige St
- 85-87 Paige St
- 59 Spencer Ave
- 7 Orchard Ave
- 117 Erie St
- 109 Spencer Ave
Your Personal Tour Guide
Ask me questions while you tour the home.