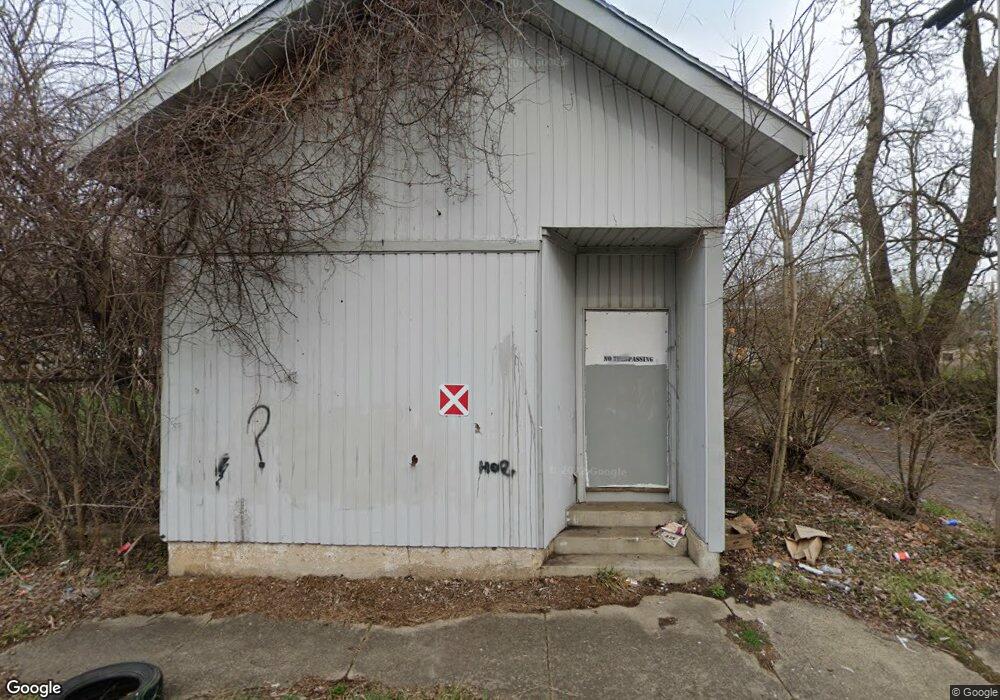
567 Elm St Springfield, OH 45503
Estimated Value: $52,232
Studio
--
Bath
3,306
Sq Ft
$16/Sq Ft
Est. Value
About This Home
This home is located at 567 Elm St, Springfield, OH 45503 and is currently estimated at $52,232, approximately $15 per square foot. 567 Elm St is a home located in Clark County with nearby schools including Lagonda Elementary School, Roosevelt Middle School, and Springfield High School.
Ownership History
Date
Name
Owned For
Owner Type
Purchase Details
Closed on
Jun 17, 2022
Sold by
Clark County Land Reutilization Corporat
Bought by
Persinger Daniel
Current Estimated Value
Purchase Details
Closed on
May 30, 2013
Sold by
Kelly Gerald E
Bought by
Kelly Kevin
Purchase Details
Closed on
May 21, 2013
Sold by
Silvertough Investments Llc
Bought by
Kelly Gerald E and Kelley Kevin
Purchase Details
Closed on
Oct 26, 2007
Sold by
Silvertouch Investments Llc
Bought by
Kelly Gerald E and Kelley Kevin
Home Financials for this Owner
Home Financials are based on the most recent Mortgage that was taken out on this home.
Original Mortgage
$22,500
Interest Rate
6.33%
Mortgage Type
Seller Take Back
Purchase Details
Closed on
Oct 1, 2004
Sold by
Jenks Jason C and Burgoyne Jenks Terri
Bought by
Silvertouch Investments Llc
Purchase Details
Closed on
Sep 19, 1996
Sold by
Bertha Lester Trst
Bought by
Mabra Chester M
Create a Home Valuation Report for This Property
The Home Valuation Report is an in-depth analysis detailing your home's value as well as a comparison with similar homes in the area
Home Values in the Area
Average Home Value in this Area
Purchase History
| Date | Buyer | Sale Price | Title Company |
|---|---|---|---|
| Persinger Daniel | -- | Ohio Real Estate Title | |
| Kelly Kevin | -- | None Available | |
| Kelly Gerald E | $25,000 | None Available | |
| Kelly Gerald E | $25,000 | Ohio Real Estate Title | |
| Silvertouch Investments Llc | $19,000 | -- | |
| Mabra Chester M | $5,000 | -- |
Source: Public Records
Mortgage History
| Date | Status | Borrower | Loan Amount |
|---|---|---|---|
| Previous Owner | Kelly Gerald E | $22,500 |
Source: Public Records
Tax History
| Year | Tax Paid | Tax Assessment Tax Assessment Total Assessment is a certain percentage of the fair market value that is determined by local assessors to be the total taxable value of land and additions on the property. | Land | Improvement |
|---|---|---|---|---|
| 2025 | $379 | $6,540 | $4,250 | $2,290 |
| 2024 | $373 | $5,140 | $3,030 | $2,110 |
| 2023 | $373 | $5,140 | $3,030 | $2,110 |
| 2022 | $19,676 | $5,140 | $3,030 | $2,110 |
| 2021 | $375 | $5,140 | $3,030 | $2,110 |
| 2020 | $375 | $5,140 | $3,030 | $2,110 |
| 2019 | $391 | $5,140 | $3,030 | $2,110 |
| 2018 | $522 | $5,970 | $3,030 | $2,940 |
| 2017 | $441 | $5,971 | $3,031 | $2,940 |
| 2016 | $439 | $5,971 | $3,031 | $2,940 |
| 2015 | $10,376 | $5,971 | $3,031 | $2,940 |
| 2014 | $469 | $6,367 | $3,031 | $3,336 |
| 2013 | $7,771 | $6,367 | $3,031 | $3,336 |
Source: Public Records
Map
Nearby Homes
- 412 E Madison Ave
- 825-827 Elm St
- 114-116 E Ward St
- 726 E Madison Ave
- 33-35 E Ward St
- 469 E Cecil St Unit 471
- 469-471 E Cecil St
- 29 E Ward St
- 802 Warder St
- 836-838 Rodgers Dr
- 307 E Northern Ave
- 0 Mitchell Blvd
- 1007 N Limestone St
- 1015 Rodgers Dr
- 736 E Northern Ave
- 1023 Garfield Ave
- 120 E Ward St
- 1224 Glenmore Dr
- 119 E McCreight Ave
- 24 Bill Edwards Dr
- 420 Chestnut Ave
- 410 Chestnut Ave
- 451 Sherman Ave Unit 453
- 459 Sherman Ave
- 408 Chestnut Ave
- 421 Sherman Ave
- 566 Elm St Unit 568
- 502 Chestnut Ave
- 570 Elm St
- 402 Chestnut Ave
- 419 Sherman Ave
- 506 Chestnut Ave
- 413 Sherman Ave Unit 415
- 507 Sherman Ave
- 346 Chestnut Ave
- 508 Chestnut Ave
- 511 Sherman Ave
- 409 Sherman Ave Unit 411
- 405 Sherman Ave Unit 407
- 342 Chestnut Ave
Your Personal Tour Guide
Ask me questions while you tour the home.