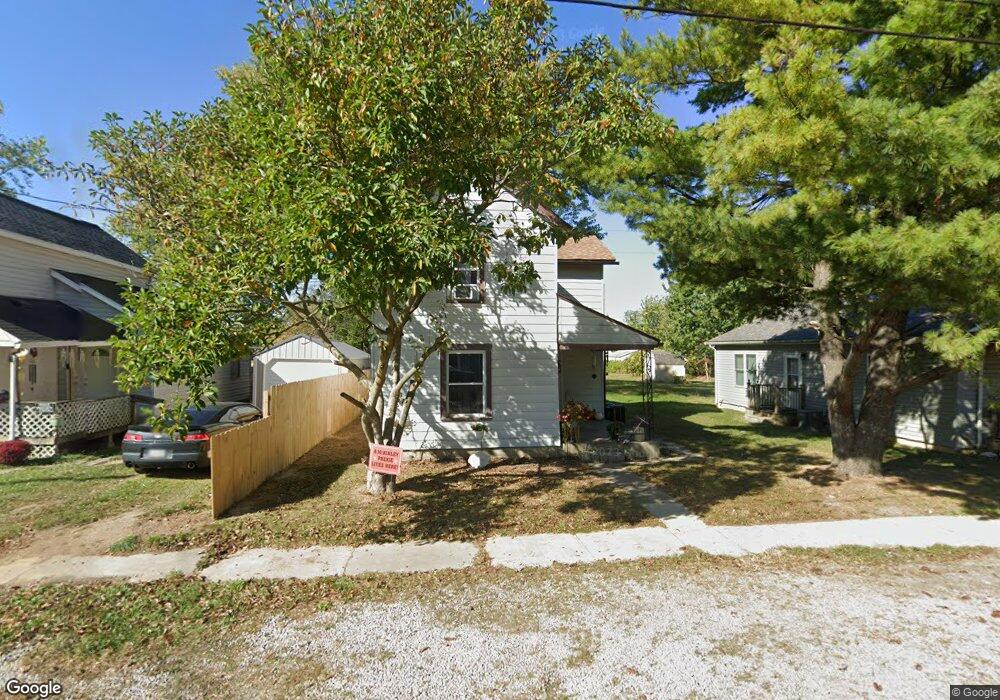
567 Mound St Marion, OH 43302
Estimated Value: $55,425 - $59,000
4
Beds
1
Bath
1,224
Sq Ft
$47/Sq Ft
Est. Value
About This Home
This home is located at 567 Mound St, Marion, OH 43302 and is currently estimated at $57,106, approximately $46 per square foot. 567 Mound St is a home located in Marion County with nearby schools including William McKinley Elementary School, Ulysses S. Grant Middle School, and Harding High School.
Ownership History
Date
Name
Owned For
Owner Type
Purchase Details
Closed on
Jul 10, 2025
Sold by
Marke Lyon Commercial Property Llc
Bought by
Shovel City Investments Llc
Current Estimated Value
Purchase Details
Closed on
Apr 11, 2024
Sold by
Lyon Barbara A
Bought by
Marke Lyon Commercial Property Llc
Purchase Details
Closed on
Jul 14, 2021
Sold by
Horner John and Horner Connie
Bought by
Lyon Barbara A
Purchase Details
Closed on
Mar 23, 2006
Sold by
Mayberry Properties Llc
Bought by
Horner John and Horner Connie
Purchase Details
Closed on
Dec 19, 2005
Sold by
Price Frederick E and Estate Of Alice M Price
Bought by
Mayberry Properties Llc
Purchase Details
Closed on
Feb 25, 1998
Bought by
Horner John and Connie Surv
Purchase Details
Closed on
Jun 9, 1997
Bought by
Horner John and Connie Surv
Create a Home Valuation Report for This Property
The Home Valuation Report is an in-depth analysis detailing your home's value as well as a comparison with similar homes in the area
Home Values in the Area
Average Home Value in this Area
Purchase History
| Date | Buyer | Sale Price | Title Company |
|---|---|---|---|
| Shovel City Investments Llc | $55,000 | None Listed On Document | |
| Shovel City Investments Llc | $55,000 | None Listed On Document | |
| Marke Lyon Commercial Property Llc | $50,000 | None Listed On Document | |
| Marke Lyon Commercial Property Llc | $50,000 | None Listed On Document | |
| Lyon Barbara A | $52,000 | None Available | |
| Horner John | $33,000 | Chicago Title | |
| Mayberry Properties Llc | $27,500 | Chicago Title | |
| Horner John | -- | -- | |
| Horner John | -- | -- |
Source: Public Records
Tax History Compared to Growth
Tax History
| Year | Tax Paid | Tax Assessment Tax Assessment Total Assessment is a certain percentage of the fair market value that is determined by local assessors to be the total taxable value of land and additions on the property. | Land | Improvement |
|---|---|---|---|---|
| 2024 | $877 | $22,850 | $3,790 | $19,060 |
| 2023 | $877 | $22,850 | $3,790 | $19,060 |
| 2022 | $860 | $22,850 | $3,790 | $19,060 |
| 2021 | $711 | $17,960 | $3,290 | $14,670 |
| 2020 | $713 | $17,960 | $3,290 | $14,670 |
| 2019 | $713 | $17,960 | $3,290 | $14,670 |
| 2018 | $648 | $16,340 | $3,260 | $13,080 |
| 2017 | $657 | $16,340 | $3,260 | $13,080 |
| 2016 | $652 | $16,340 | $3,260 | $13,080 |
| 2015 | $651 | $15,940 | $3,100 | $12,840 |
| 2014 | $1,066 | $15,940 | $3,100 | $12,840 |
| 2012 | $662 | $16,080 | $2,320 | $13,760 |
Source: Public Records
Map
Nearby Homes
- 579 Henry St
- 512 Henry St
- 681 Davids St
- 645 Henry St
- 668 Uncapher Ave
- 545 Blaine Ave
- 403 Uncapher Ave
- 720 Woodrow Ave
- 426 Bellefontaine Ave
- 824 Oak Grove Ave
- 593 Windsor St
- 625 Rochelle Dr
- 618 Windsor St
- 796 Woodrow Ave
- 354 Bellefontaine Ave
- 393 Windsor St
- 757 Merkle Ave
- 429 W Columbia St
- 546 Cherry St
- 889 Oak Grove Ave