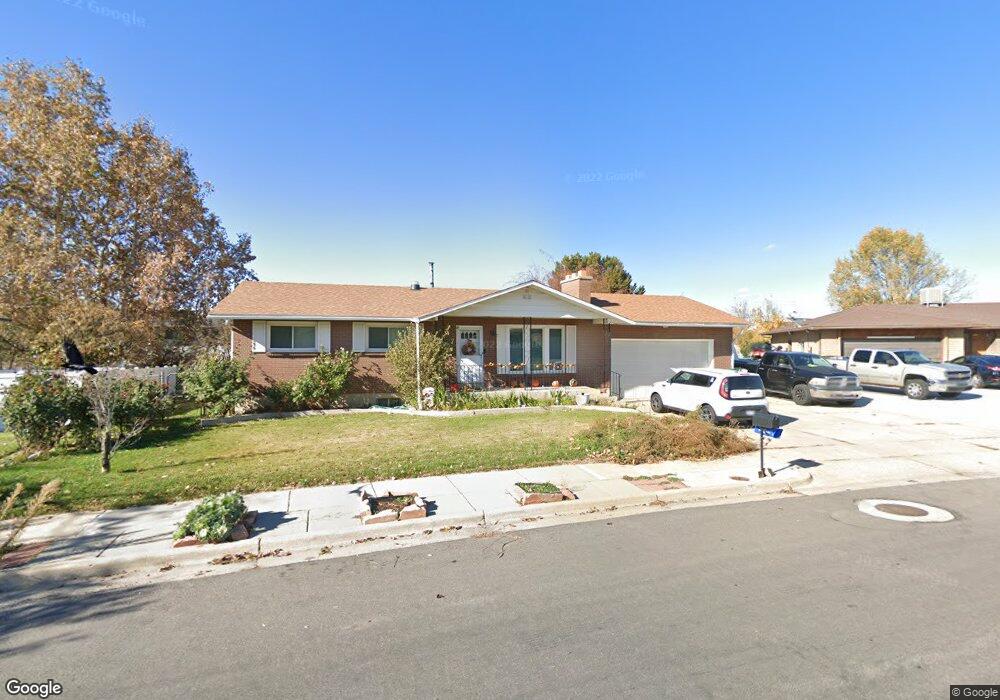
567 N Adamswood Rd Layton, UT 84040
Estimated Value: $463,000 - $512,000
5
Beds
3
Baths
2,352
Sq Ft
$208/Sq Ft
Est. Value
About This Home
This home is located at 567 N Adamswood Rd, Layton, UT 84040 and is currently estimated at $488,087, approximately $207 per square foot. 567 N Adamswood Rd is a home located in Davis County with nearby schools including King Elementary School, Central Davis Junior High School, and Layton High School.
Ownership History
Date
Name
Owned For
Owner Type
Purchase Details
Closed on
Jan 3, 2022
Sold by
Nelson Danny and Nelson Rusty
Bought by
Wong Pak C and Li Suzie
Current Estimated Value
Home Financials for this Owner
Home Financials are based on the most recent Mortgage that was taken out on this home.
Original Mortgage
$322,500
Outstanding Balance
$296,655
Interest Rate
3.12%
Mortgage Type
New Conventional
Estimated Equity
$191,432
Purchase Details
Closed on
Mar 23, 2020
Sold by
Nelson R Kay R and Nelson Carol G
Bought by
Nelson Danny and Nelson Rusty
Purchase Details
Closed on
Jul 8, 1998
Sold by
Nelson R Kay and Nelson Carol G
Bought by
Nelson R Kay and Nelson Carol G
Home Financials for this Owner
Home Financials are based on the most recent Mortgage that was taken out on this home.
Original Mortgage
$77,413
Interest Rate
7.03%
Mortgage Type
Balloon
Create a Home Valuation Report for This Property
The Home Valuation Report is an in-depth analysis detailing your home's value as well as a comparison with similar homes in the area
Home Values in the Area
Average Home Value in this Area
Purchase History
| Date | Buyer | Sale Price | Title Company |
|---|---|---|---|
| Wong Pak C | -- | Cottonwood Title Ins | |
| Nelson Danny | -- | None Available | |
| Nelson R Kay | -- | Bonneville Title Company | |
| Nelson R Kay | -- | Bonneville Title Company |
Source: Public Records
Mortgage History
| Date | Status | Borrower | Loan Amount |
|---|---|---|---|
| Open | Wong Pak C | $322,500 | |
| Previous Owner | Nelson R Kay | $77,413 |
Source: Public Records
Tax History Compared to Growth
Tax History
| Year | Tax Paid | Tax Assessment Tax Assessment Total Assessment is a certain percentage of the fair market value that is determined by local assessors to be the total taxable value of land and additions on the property. | Land | Improvement |
|---|---|---|---|---|
| 2025 | $2,478 | $260,150 | $127,064 | $133,086 |
| 2024 | $2,372 | $250,799 | $150,445 | $100,354 |
| 2023 | $2,339 | $239,800 | $111,032 | $128,767 |
| 2022 | $2,456 | $248,600 | $108,372 | $140,228 |
| 2021 | $2,173 | $328,000 | $165,068 | $162,932 |
| 2020 | $1,906 | $276,000 | $134,198 | $141,802 |
| 2019 | $1,890 | $268,000 | $119,763 | $148,237 |
| 2018 | $1,707 | $243,000 | $93,650 | $149,350 |
| 2016 | $1,658 | $121,770 | $49,204 | $72,566 |
| 2015 | $1,530 | $106,700 | $49,204 | $57,496 |
| 2014 | $1,470 | $104,816 | $49,204 | $55,612 |
| 2013 | -- | $97,680 | $22,748 | $74,932 |
Source: Public Records
Map
Nearby Homes
- 556 N Fairfield Rd Unit A2
- 556 N Fairfield Rd Unit D1
- 556 N Fairfield Rd Unit D2
- 556 N Fairfield Rd Unit A3
- 556 N Fairfield Rd Unit D3
- 556 N Fairfield Rd Unit D4
- 556 N Fairfield Rd Unit A1
- 556 N Fairfield Rd Unit A4
- 508 N Adamswood Rd
- 861 E 575 N
- 857 E 575 N
- 880 E 350 N
- 654 Colonial St
- 580 N Allanwood Place
- 479 N 1375 E
- 794 Valeria Dr
- 1247 E 300 N
- 1503 E 530 N
- 785 Sherwood Dr
- 942 E Gentile St
- 539 N Adamswood Rd
- 581 N Adamswood Rd
- 884 E 575 N
- 884 E 575 N Unit 20B
- 880 E 575 N
- 529 N Adamswood Rd
- 929 Wasatch Dr
- 878 E 575 N
- 574 N Adamswood Rd
- 593 N Snowcreek Cir
- 876 E 575 N
- 588 N Adamswood Rd
- 872 E 575 N
- 536 N Adamswood Rd
- 556 N Fairfield Rd Unit C4
- 556 N Fairfield Rd Unit C3
- 556 N Fairfield Rd Unit C2
- 556 N Fairfield Rd Unit C1
- 556 N Fairfield Rd Unit B4
- 556 N Fairfield Rd Unit B3