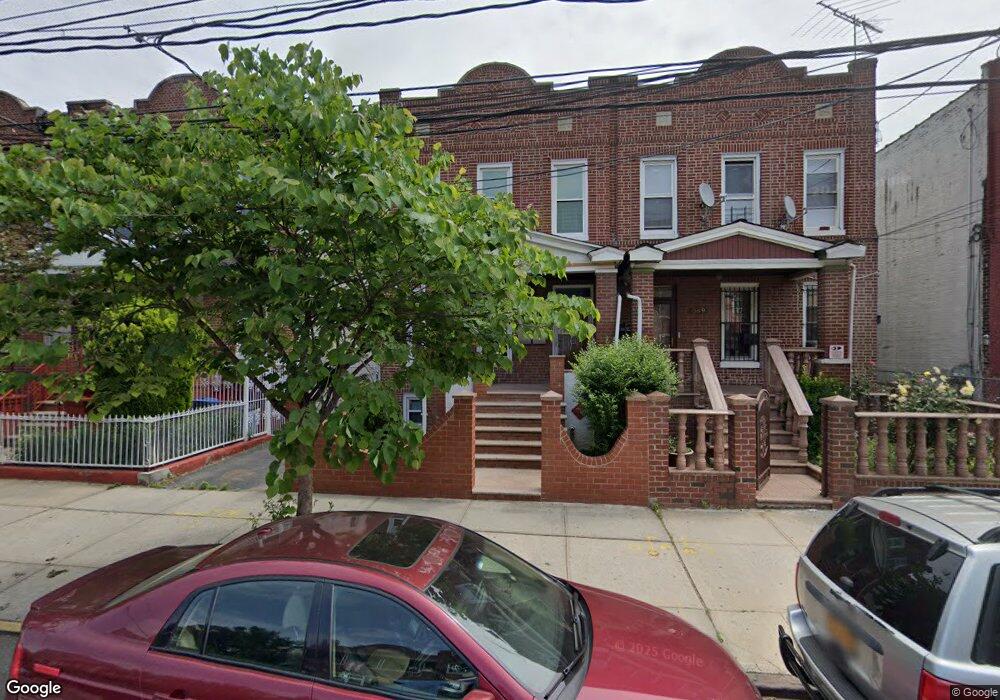
567 New Jersey Ave Brooklyn, NY 11207
East New York NeighborhoodEstimated Value: $755,707 - $848,000
3
Beds
2
Baths
2,000
Sq Ft
$394/Sq Ft
Est. Value
About This Home
This home is located at 567 New Jersey Ave, Brooklyn, NY 11207 and is currently estimated at $788,177, approximately $394 per square foot. 567 New Jersey Ave is a home located in Kings County with nearby schools including P.S. 13 Roberto Clemente, J.H.S 292 Margaret S. Douglas, and Achievement First - East New York School.
Ownership History
Date
Name
Owned For
Owner Type
Purchase Details
Closed on
Jan 21, 2016
Sold by
Williams Lonzie
Bought by
Williams Paul
Current Estimated Value
Home Financials for this Owner
Home Financials are based on the most recent Mortgage that was taken out on this home.
Original Mortgage
$479,161
Outstanding Balance
$381,336
Interest Rate
3.98%
Mortgage Type
New Conventional
Estimated Equity
$406,841
Purchase Details
Closed on
Nov 21, 2005
Sold by
Williams and Lonzo
Bought by
Williams Lonzie and Williams Sarah
Purchase Details
Closed on
Apr 10, 2001
Sold by
Williams Alberta
Bought by
Williams Lonzie and Williams Sarah
Purchase Details
Closed on
Apr 26, 1995
Sold by
Williams Alberta
Bought by
Williams Alberta and Williams Lonza
Create a Home Valuation Report for This Property
The Home Valuation Report is an in-depth analysis detailing your home's value as well as a comparison with similar homes in the area
Home Values in the Area
Average Home Value in this Area
Purchase History
| Date | Buyer | Sale Price | Title Company |
|---|---|---|---|
| Williams Paul | $488,000 | -- | |
| Williams Paul | $488,000 | -- | |
| Williams Lonzie | -- | -- | |
| Williams Lonzie | -- | -- | |
| Williams Lonzie | -- | -- | |
| Williams Lonzie | -- | -- | |
| Williams Alberta | -- | Commonwealth Land Title Ins | |
| Williams Alberta | -- | Commonwealth Land Title Ins |
Source: Public Records
Mortgage History
| Date | Status | Borrower | Loan Amount |
|---|---|---|---|
| Open | Williams Paul | $479,161 | |
| Closed | Williams Paul | $479,161 |
Source: Public Records
Tax History Compared to Growth
Tax History
| Year | Tax Paid | Tax Assessment Tax Assessment Total Assessment is a certain percentage of the fair market value that is determined by local assessors to be the total taxable value of land and additions on the property. | Land | Improvement |
|---|---|---|---|---|
| 2025 | $2,936 | $52,380 | $19,560 | $32,820 |
| 2024 | $2,936 | $46,680 | $19,560 | $27,120 |
| 2023 | $2,801 | $41,280 | $19,560 | $21,720 |
| 2022 | $2,753 | $38,220 | $19,560 | $18,660 |
| 2021 | $2,744 | $39,780 | $19,560 | $20,220 |
| 2020 | $1,349 | $33,900 | $19,560 | $14,340 |
| 2019 | $2,548 | $33,900 | $19,560 | $14,340 |
| 2018 | $2,343 | $11,493 | $7,096 | $4,397 |
| 2017 | $2,343 | $11,493 | $7,361 | $4,132 |
| 2016 | $2,172 | $10,866 | $6,584 | $4,282 |
| 2015 | $1,308 | $10,747 | $6,689 | $4,058 |
| 2014 | $1,308 | $10,152 | $7,586 | $2,566 |
Source: Public Records
Map
Nearby Homes
- 486 Vermont St
- 593 Bradford St
- 427 New Lots Ave
- 421 New Lots Ave
- 477 Vermont St
- 659 Miller Ave
- 584 van Siclen Ave Unit 2
- 626 Blake Ave
- 582 van Siclen Ave Unit 3
- 637 Blake Ave
- 622 van Siclen Ave
- 444 New Jersey Ave
- 778 Livonia Ave
- 780 Livonia Ave
- 725 Vermont St
- 412 Bradford St
- 353 Pennsylvania Ave
- 774 Blake Ave
- 680 Hendrix St
- 661 Sheffield Ave
- 567 New Jersey Ave Unit 2
- 569 New Jersey Ave
- 563 New Jersey Ave
- 573 New Jersey Ave
- 561 New Jersey Ave
- 575 New Jersey Ave
- 559 New Jersey Ave
- 557 New Jersey Ave
- 579 New Jersey Ave
- 566 Vermont St Unit D
- 566 Vermont St Unit C
- 566 Vermont St Unit B
- 566 Vermont St Unit A
- 566 Vermont St
- 568 Vermont St
- 572 Vermont St
- 581 New Jersey Ave
- 581 New Jersey Ave Unit Storefront
- 555 New Jersey Ave Unit 2
- 555 New Jersey Ave