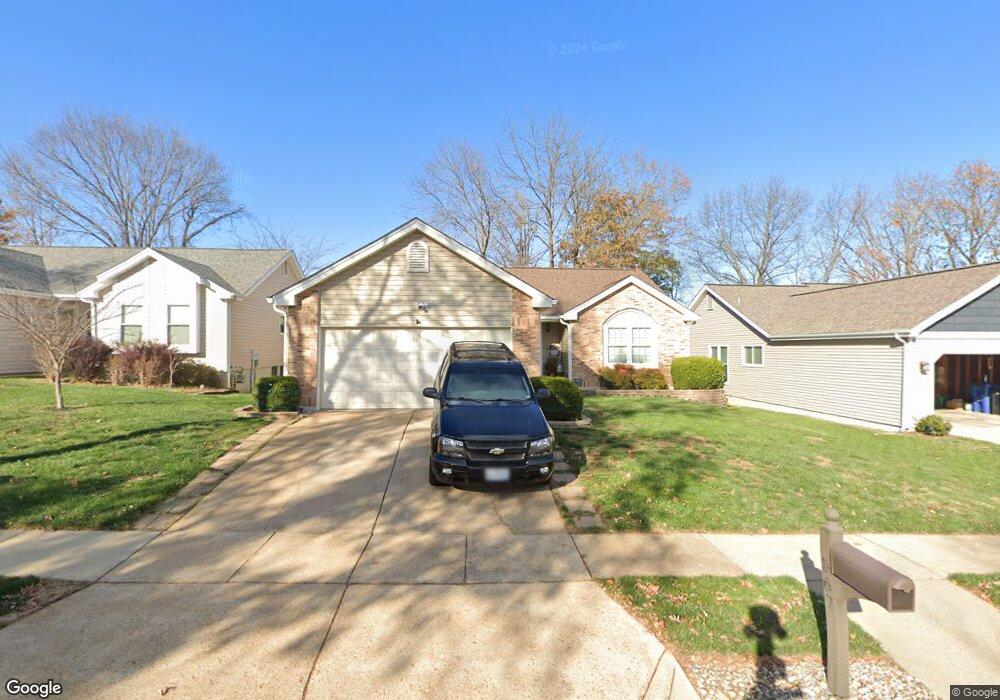
567 Oaktree Crossing Ct Ballwin, MO 63021
Estimated Value: $326,211 - $367,000
3
Beds
2
Baths
1,494
Sq Ft
$233/Sq Ft
Est. Value
About This Home
This home is located at 567 Oaktree Crossing Ct, Ballwin, MO 63021 and is currently estimated at $348,303, approximately $233 per square foot. 567 Oaktree Crossing Ct is a home located in St. Louis County with nearby schools including Oak Brook Elementary School, Parkway Southwest Middle School, and Parkway South High School.
Ownership History
Date
Name
Owned For
Owner Type
Purchase Details
Closed on
Aug 31, 2006
Sold by
Nadt Investment Specialist Llc
Bought by
Bausch Timothy M and Bausch Rachel
Current Estimated Value
Home Financials for this Owner
Home Financials are based on the most recent Mortgage that was taken out on this home.
Original Mortgage
$40,000
Interest Rate
6.28%
Mortgage Type
Stand Alone Second
Purchase Details
Closed on
Dec 12, 2005
Sold by
Moore Ryan
Bought by
Nadt Investment Specialist Llc
Home Financials for this Owner
Home Financials are based on the most recent Mortgage that was taken out on this home.
Original Mortgage
$198,050
Interest Rate
6.12%
Mortgage Type
Construction
Purchase Details
Closed on
Sep 16, 1999
Sold by
Friederich Gregory C
Bought by
Friederich Jennie F
Purchase Details
Closed on
Dec 18, 1998
Sold by
Krieger Daniel J and Krieger Barbara J
Bought by
Friederich Jennie F
Home Financials for this Owner
Home Financials are based on the most recent Mortgage that was taken out on this home.
Original Mortgage
$109,600
Interest Rate
6.85%
Create a Home Valuation Report for This Property
The Home Valuation Report is an in-depth analysis detailing your home's value as well as a comparison with similar homes in the area
Home Values in the Area
Average Home Value in this Area
Purchase History
| Date | Buyer | Sale Price | Title Company |
|---|---|---|---|
| Bausch Timothy M | $200,000 | None Available | |
| Nadt Investment Specialist Llc | $165,000 | -- | |
| Moore Ryan | $140,000 | -- | |
| Friederich Jennie F | -- | -- | |
| Friederich Jennie F | $137,000 | First American Title |
Source: Public Records
Mortgage History
| Date | Status | Borrower | Loan Amount |
|---|---|---|---|
| Closed | Bausch Timothy M | $40,000 | |
| Open | Bausch Timothy M | $160,000 | |
| Previous Owner | Moore Ryan | $198,050 | |
| Previous Owner | Friederich Jennie F | $109,600 |
Source: Public Records
Tax History
| Year | Tax Paid | Tax Assessment Tax Assessment Total Assessment is a certain percentage of the fair market value that is determined by local assessors to be the total taxable value of land and additions on the property. | Land | Improvement |
|---|---|---|---|---|
| 2025 | $3,462 | $57,570 | $27,020 | $30,550 |
| 2024 | $3,462 | $53,200 | $17,370 | $35,830 |
| 2023 | $3,493 | $53,200 | $17,370 | $35,830 |
| 2022 | $3,395 | $47,380 | $19,300 | $28,080 |
| 2021 | $3,375 | $47,380 | $19,300 | $28,080 |
| 2020 | $3,179 | $42,640 | $17,200 | $25,440 |
| 2019 | $3,142 | $42,640 | $17,200 | $25,440 |
| 2018 | $3,051 | $38,310 | $13,380 | $24,930 |
| 2017 | $3,016 | $38,310 | $13,380 | $24,930 |
| 2016 | $2,907 | $35,000 | $9,580 | $25,420 |
Source: Public Records
Map
Nearby Homes
- 540 Woodlyn Crossing
- 603 Painted Vista Dr Unit 285
- 1545 Greenfield Crossing Ct
- 634 Sandy Summit Dr
- 461 Elm Crossing Ct
- 1249 Arbor Bluff Cir
- 1209 Lofty Point Dr Unit A
- 705 Lofty Point Dr Unit A
- 1389 Red Oak Plantation Dr
- 1432 Westbrooke Terrace Dr
- 1605 Forest Springs Ln Unit A
- 1316 Westbrooke Terrace Dr
- 313 Brightfield Dr
- 1530 Apple Way Ct
- 215 Straightoak Ct
- 210 Vistaoak Ct
- 846 Pheasant Woods Dr
- 952 Meramec Grove Dr
- 1462 Carriage Bridge Trail
- 1716 Whispering Creek Dr Unit C
- 563 Oaktree Crossing Ct
- 571 Oaktree Crossing Ct
- 559 Oaktree Crossing Ct
- 575 Oaktree Crossing Ct
- 566 Oaktree Crossing Ct
- 555 Oaktree Crossing Ct
- 562 Oaktree Crossing Ct
- 579 Oaktree Crossing Ct
- 570 Oaktree Crossing Ct
- 551 Oaktree Crossing Ct
- 558 Oaktree Crossing Ct
- 558 Treetop Village Dr
- 578 Oaktree Crossing Ct
- 550 Treetop Village Dr
- 574 Oaktree Crossing Ct
- 554 Treetop Village Dr
- 554 Oaktree Crossing Ct
- 562 Treetop Village Dr
- 547 Oaktree Crossing Ct
- 546 Treetop Village Dr
Your Personal Tour Guide
Ask me questions while you tour the home.