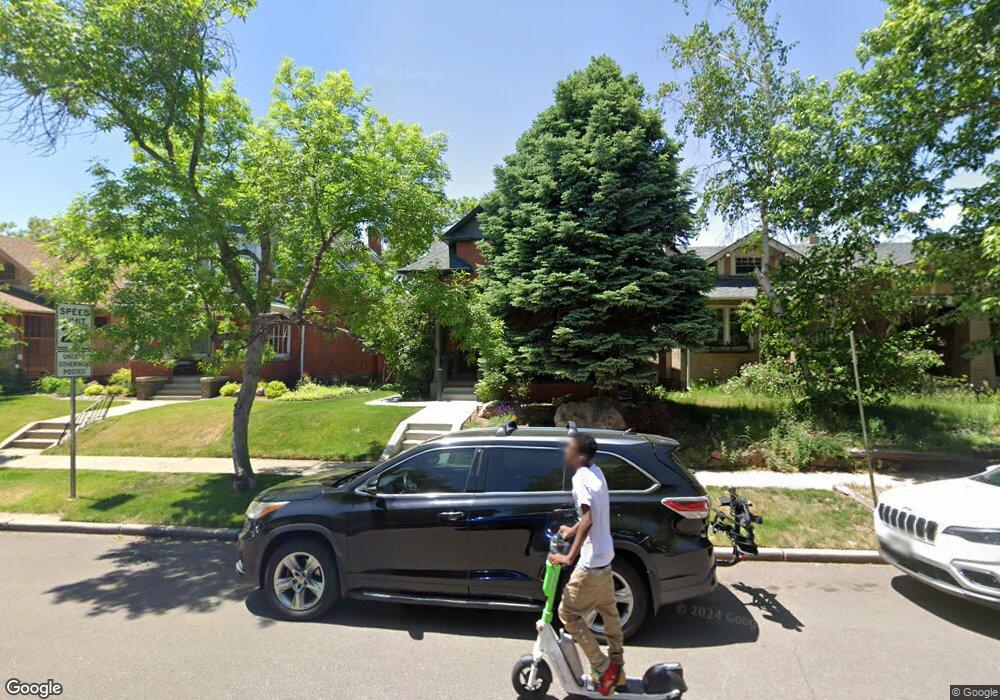
567 Ogden St Denver, CO 80218
Alamo Placita NeighborhoodEstimated Value: $910,483 - $1,059,000
3
Beds
3
Baths
2,054
Sq Ft
$484/Sq Ft
Est. Value
About This Home
This home is located at 567 Ogden St, Denver, CO 80218 and is currently estimated at $993,121, approximately $483 per square foot. 567 Ogden St is a home located in Denver County with nearby schools including Dora Moore ECE-8 School, Morey Middle School, and East High School.
Ownership History
Date
Name
Owned For
Owner Type
Purchase Details
Closed on
Feb 28, 2001
Sold by
Burke Patrick D
Bought by
Gordon Steven C and Nelson Susan M
Current Estimated Value
Home Financials for this Owner
Home Financials are based on the most recent Mortgage that was taken out on this home.
Original Mortgage
$351,200
Interest Rate
6.75%
Purchase Details
Closed on
Dec 20, 1999
Sold by
Rosenberg Scott A
Bought by
Burke Patrick D and Burke Lynn S
Home Financials for this Owner
Home Financials are based on the most recent Mortgage that was taken out on this home.
Original Mortgage
$239,200
Interest Rate
7.12%
Purchase Details
Closed on
Oct 31, 1996
Sold by
Schmit Ayn E and Schmit Brian K
Bought by
Rosenberg Scott A and Rosenberg Corin B
Home Financials for this Owner
Home Financials are based on the most recent Mortgage that was taken out on this home.
Original Mortgage
$169,600
Interest Rate
8.15%
Create a Home Valuation Report for This Property
The Home Valuation Report is an in-depth analysis detailing your home's value as well as a comparison with similar homes in the area
Home Values in the Area
Average Home Value in this Area
Purchase History
| Date | Buyer | Sale Price | Title Company |
|---|---|---|---|
| Gordon Steven C | $439,000 | Stewart Title | |
| Burke Patrick D | $299,000 | -- | |
| Rosenberg Scott A | $212,000 | Land Title |
Source: Public Records
Mortgage History
| Date | Status | Borrower | Loan Amount |
|---|---|---|---|
| Previous Owner | Gordon Steven C | $351,200 | |
| Previous Owner | Burke Patrick D | $239,200 | |
| Previous Owner | Rosenberg Scott A | $169,600 |
Source: Public Records
Tax History Compared to Growth
Tax History
| Year | Tax Paid | Tax Assessment Tax Assessment Total Assessment is a certain percentage of the fair market value that is determined by local assessors to be the total taxable value of land and additions on the property. | Land | Improvement |
|---|---|---|---|---|
| 2024 | $4,684 | $59,140 | $12,840 | $46,300 |
| 2023 | $4,583 | $59,140 | $12,840 | $46,300 |
| 2022 | $4,398 | $55,300 | $17,140 | $38,160 |
| 2021 | $4,244 | $56,880 | $17,630 | $39,250 |
| 2020 | $3,780 | $50,940 | $16,030 | $34,910 |
| 2019 | $3,674 | $50,940 | $16,030 | $34,910 |
| 2018 | $3,334 | $43,090 | $14,520 | $28,570 |
| 2017 | $3,324 | $43,090 | $14,520 | $28,570 |
| 2016 | $3,149 | $38,610 | $15,164 | $23,446 |
| 2015 | $3,016 | $38,610 | $15,164 | $23,446 |
| 2014 | $3,126 | $37,640 | $10,268 | $27,372 |
Source: Public Records
Map
Nearby Homes
- 620 Emerson St
- 680 Emerson St
- 685 N Emerson St
- 680 N Clarkson St
- 440 N Clarkson St
- 1000 E 7th Ave
- 636 N Washington St Unit 102
- 636 N Washington St Unit 301
- 432 N Ogden St
- 424 N Clarkson St
- 486 N Corona St
- 415 N Clarkson St
- 707 Corona St
- 665 Washington St Unit 5B
- 1006 E 4th Ave
- 461 N Downing St
- 1002 E 4th Ave
- 715 E 4th Ave
- 575 N Marion St
- 700 N Washington St Unit 201