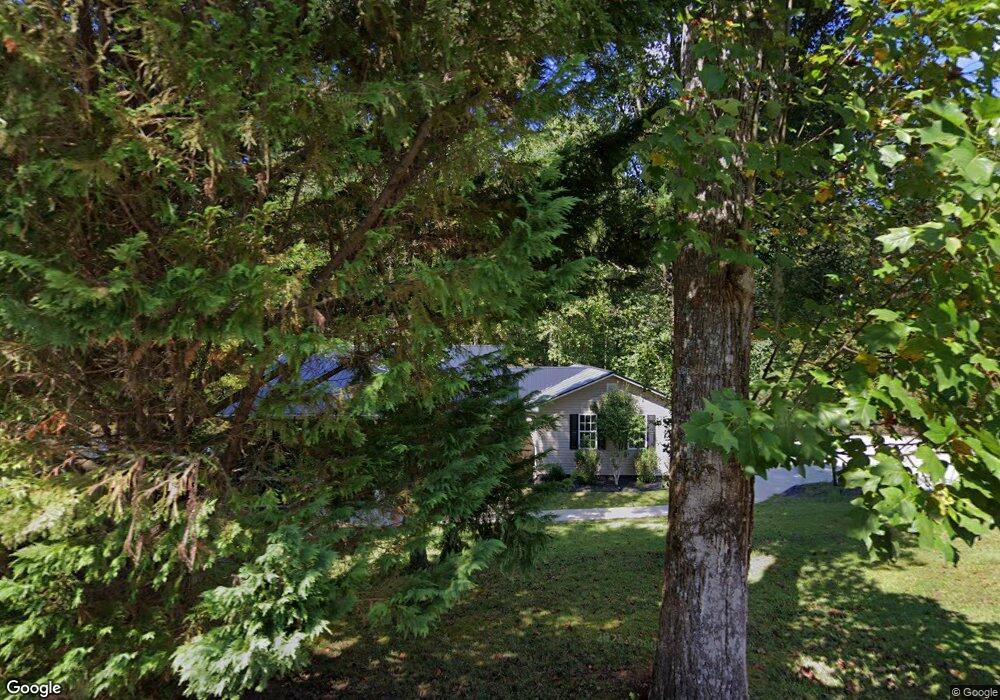
567 Pecks Mill Creek Rd Dahlonega, GA 30533
Estimated Value: $349,000 - $435,000
--
Bed
2
Baths
1,611
Sq Ft
$243/Sq Ft
Est. Value
About This Home
This home is located at 567 Pecks Mill Creek Rd, Dahlonega, GA 30533 and is currently estimated at $391,191, approximately $242 per square foot. 567 Pecks Mill Creek Rd is a home located in Lumpkin County with nearby schools including Clay County Middle School and Lumpkin County High School.
Ownership History
Date
Name
Owned For
Owner Type
Purchase Details
Closed on
Aug 25, 2011
Sold by
Barrett Rhonda H
Bought by
Gilreath Rhonda H
Current Estimated Value
Home Financials for this Owner
Home Financials are based on the most recent Mortgage that was taken out on this home.
Original Mortgage
$128,000
Outstanding Balance
$11,504
Interest Rate
4.55%
Mortgage Type
New Conventional
Estimated Equity
$379,687
Purchase Details
Closed on
May 31, 2000
Sold by
Barrett Rhonda H
Bought by
Barrett Rhonda H
Purchase Details
Closed on
Jun 18, 1999
Sold by
Harkins Linda S
Bought by
Barrett Rhonda H
Purchase Details
Closed on
Mar 9, 1994
Sold by
Harkins Linda S
Bought by
Harkins Linda S
Purchase Details
Closed on
Dec 10, 1993
Sold by
Harkins Ronald V
Bought by
Harkins Linda S
Purchase Details
Closed on
Apr 1, 1978
Bought by
Harkins Ronald V
Create a Home Valuation Report for This Property
The Home Valuation Report is an in-depth analysis detailing your home's value as well as a comparison with similar homes in the area
Home Values in the Area
Average Home Value in this Area
Purchase History
| Date | Buyer | Sale Price | Title Company |
|---|---|---|---|
| Gilreath Rhonda H | -- | -- | |
| Barrett Rhonda H | -- | -- | |
| Barrett Rhonda H | -- | -- | |
| Harkins Linda S | -- | -- | |
| Harkins Linda S | -- | -- | |
| Harkins Ronald V | -- | -- |
Source: Public Records
Mortgage History
| Date | Status | Borrower | Loan Amount |
|---|---|---|---|
| Open | Gilreath Rhonda H | $128,000 |
Source: Public Records
Tax History Compared to Growth
Tax History
| Year | Tax Paid | Tax Assessment Tax Assessment Total Assessment is a certain percentage of the fair market value that is determined by local assessors to be the total taxable value of land and additions on the property. | Land | Improvement |
|---|---|---|---|---|
| 2024 | $2,689 | $117,713 | $19,580 | $98,133 |
| 2023 | $2,135 | $110,347 | $18,299 | $92,048 |
| 2022 | $2,317 | $95,577 | $15,249 | $80,328 |
| 2021 | $2,080 | $83,255 | $15,249 | $68,006 |
| 2020 | $2,082 | $80,932 | $14,612 | $66,320 |
| 2019 | $2,101 | $80,932 | $14,612 | $66,320 |
| 2018 | $2,012 | $72,910 | $14,612 | $58,298 |
| 2017 | $1,987 | $70,673 | $14,612 | $56,061 |
| 2016 | $1,851 | $63,904 | $14,612 | $49,292 |
| 2015 | $1,661 | $63,905 | $14,612 | $49,292 |
| 2014 | $1,661 | $65,018 | $14,612 | $50,405 |
| 2013 | -- | $54,328 | $14,612 | $39,716 |
Source: Public Records
Map
Nearby Homes
- 0 Bearden Rd Unit 10598024
- 0 Bearden Rd Unit 7642996
- 83 Austin Ct
- 0 Arborwood Dr Unit 10645890
- 300 Mountain Ridge Dr
- 202 Indian Trail
- 1228 Winters Mountain Rd
- 87 Tolleffs Trail
- 0 Winters Mountain Rd Unit 7681054
- 0 Winters Mountain Rd Unit 10643431
- 128 Young Deer Dr
- 496 Beaver Dam Rd
- 962 Winters Mountain Rd
- 380 Copper Mill Rd
- 03 Kate Rd
- 7.123 Acres Halls Mill Rd
- 0 Porter Springs Rd Unit 7685063
- 0 Porter Springs Rd Unit 10648400
- 302 Pointe Cir
- 6480 Highway 52 W
- 508 Pecks Mill Creek Rd
- 400 Pecks Mill Creek Rd
- 626 Pecks Mill Creek Rd
- 429 Pecks Mill Creek Rd
- 338 Pecks Mill Creek Rd
- 0 Azure Rd
- 0 Azure Rd Unit 7396026
- 0 Azure Rd Unit 4&5 8662533
- 373 Pecks Mill Creek Rd
- 625 Pecks Mill Creek Rd
- 326 Pecks Mill Creek Rd
- 417 Pecks Mill Creek Rd
- 643 Pecks Mill Creek Rd
- 197 Red Hen Rd
- 297 Pecks Mill Creek Rd
- 415 Pecks Mill Creek Rd
- 46 Thomas Rd
- 139 Thomas Rd
- 52 Red Hen Rd
- 107 Azure Rd