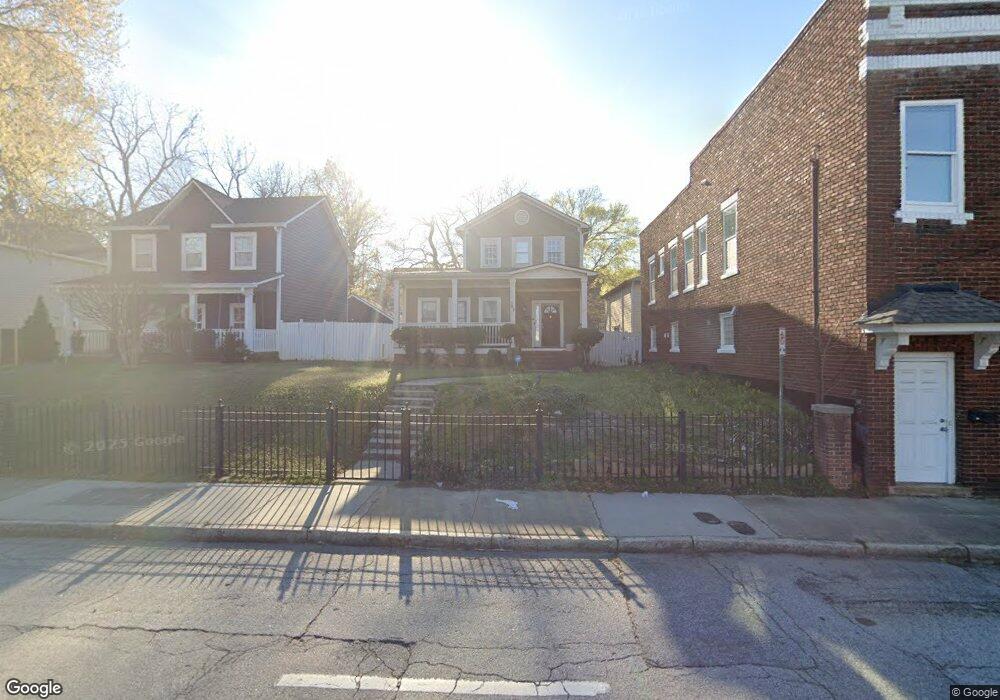
567 Pryor St SW Atlanta, GA 30312
Mechanicsville NeighborhoodEstimated Value: $320,000 - $570,000
3
Beds
3
Baths
1,784
Sq Ft
$220/Sq Ft
Est. Value
About This Home
This home is located at 567 Pryor St SW, Atlanta, GA 30312 and is currently estimated at $392,395, approximately $219 per square foot. 567 Pryor St SW is a home located in Fulton County with nearby schools including Dunbar Elementary School, King Middle School, and Maynard Holbrook Jackson High School.
Ownership History
Date
Name
Owned For
Owner Type
Purchase Details
Closed on
Jul 31, 2024
Sold by
Harrison Dymeka A
Bought by
Dymeka Harrison Living Trust and Harrison Dymeka A Tr
Current Estimated Value
Purchase Details
Closed on
Sep 2, 2020
Sold by
Lowery Frederick M
Bought by
Harrison Dymeka A
Purchase Details
Closed on
Sep 29, 2014
Sold by
Wilson Eric W
Bought by
Lowery Frederick M
Home Financials for this Owner
Home Financials are based on the most recent Mortgage that was taken out on this home.
Original Mortgage
$74,400
Interest Rate
4.16%
Mortgage Type
New Conventional
Purchase Details
Closed on
Dec 31, 1999
Sold by
Chisolm Wilson Charisse
Bought by
Wilson Eric and Wilson Charisse C
Home Financials for this Owner
Home Financials are based on the most recent Mortgage that was taken out on this home.
Original Mortgage
$161,300
Interest Rate
7.87%
Mortgage Type
New Conventional
Create a Home Valuation Report for This Property
The Home Valuation Report is an in-depth analysis detailing your home's value as well as a comparison with similar homes in the area
Home Values in the Area
Average Home Value in this Area
Purchase History
| Date | Buyer | Sale Price | Title Company |
|---|---|---|---|
| Dymeka Harrison Living Trust | -- | -- | |
| Harrison Dymeka A | -- | -- | |
| Lowery Frederick M | -- | -- | |
| Lowery Frederick M | $93,000 | -- | |
| Wilson Eric | -- | -- | |
| Wilson Charisse C | -- | -- | |
| Wilson Charisse C | $166,300 | -- |
Source: Public Records
Mortgage History
| Date | Status | Borrower | Loan Amount |
|---|---|---|---|
| Previous Owner | Lowery Frederick M | $74,400 | |
| Previous Owner | Wilson Charisse C | $161,300 |
Source: Public Records
Tax History Compared to Growth
Tax History
| Year | Tax Paid | Tax Assessment Tax Assessment Total Assessment is a certain percentage of the fair market value that is determined by local assessors to be the total taxable value of land and additions on the property. | Land | Improvement |
|---|---|---|---|---|
| 2025 | $3,711 | $115,280 | $28,640 | $86,640 |
| 2023 | $4,885 | $118,000 | $34,400 | $83,600 |
| 2022 | $4,775 | $118,000 | $34,400 | $83,600 |
| 2021 | $3,712 | $91,640 | $23,200 | $68,440 |
| 2020 | $2,953 | $72,080 | $19,160 | $52,920 |
| 2019 | $867 | $52,080 | $13,280 | $38,800 |
| 2018 | $2,093 | $50,560 | $13,920 | $36,640 |
| 2017 | $1,083 | $25,080 | $6,160 | $18,920 |
| 2016 | $1,086 | $25,080 | $6,160 | $18,920 |
| 2015 | $1,089 | $25,080 | $6,160 | $18,920 |
| 2014 | $1,137 | $25,080 | $6,160 | $18,920 |
Source: Public Records
Map
Nearby Homes
- 561 Formwalt St SW Unit 5
- 561 Formwalt St SW Unit 8
- 225 Crumley St SW
- 634 Cooper St SW
- 272 Glenn St SW
- 567 Cooper St SW
- 581 Cooper St SW
- 522 Pryor St SW
- 293 Glenn St SW
- 582 Windsor St SW
- 277 Ralph David Abernathy Blvd SW
- 502 Pryor St SW Unit 113
- 502 Pryor St SW Unit 125
- 502 Pryor St SW Unit 223
- 0 Pryor St SW
- 449 Formwalt St SW
- 450 Central Ave SW
- 665 Windsor St SW
- 670 Garibaldi St SW
- 585 Ira St SW
- 571 Pryor St SW
- 218 Crumley St SW Unit B
- 218 Crumley St SW
- 559 Pryor St SW
- 559 Pryor St SW Unit 2,3,4
- 559 Pryor St SW Unit 4
- 559 Pryor St SW Unit 3
- 559 Pryor St SW Unit 2
- 559 Pryor St SW Unit 1
- 559 Pryor St SW
- 555 Pryor St SW
- 217 Crumley St SW
- 563 Pryor St SW
- 561 Pryor St SW
- 561 Pryor St SW Unit 3
- 563 Pryor St SW Unit 4
- 561 Formwalt St SW Unit Cozy 2br 1 bath near
- 571 Formwalt St SW
- 561 Formwalt St SW
- 571 Formwalt St SW Unit 12