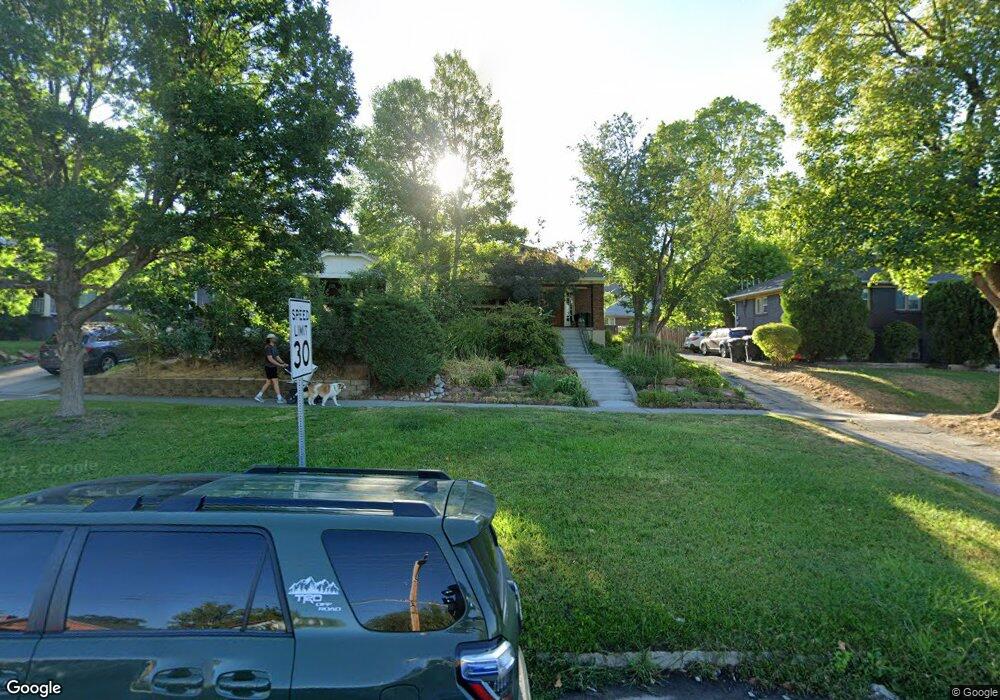
567 S 900 E Salt Lake City, UT 84102
East Central NeighborhoodEstimated Value: $513,000 - $666,000
4
Beds
1
Bath
1,082
Sq Ft
$527/Sq Ft
Est. Value
About This Home
This home is located at 567 S 900 E, Salt Lake City, UT 84102 and is currently estimated at $569,689, approximately $526 per square foot. 567 S 900 E is a home located in Salt Lake County with nearby schools including Bennion Elementary School, Wasatch Elementary School, and East High School.
Ownership History
Date
Name
Owned For
Owner Type
Purchase Details
Closed on
Dec 7, 1995
Sold by
Pease Larry K
Bought by
Pease Larry
Current Estimated Value
Home Financials for this Owner
Home Financials are based on the most recent Mortgage that was taken out on this home.
Original Mortgage
$121,000
Outstanding Balance
$2,502
Interest Rate
7.48%
Estimated Equity
$567,187
Purchase Details
Closed on
Mar 7, 1995
Sold by
Frick Robert M
Bought by
Pease Larry K
Home Financials for this Owner
Home Financials are based on the most recent Mortgage that was taken out on this home.
Original Mortgage
$116,500
Interest Rate
9.21%
Purchase Details
Closed on
Mar 28, 1994
Sold by
Nystrom Kristofer E and Nystrom Ranell M
Bought by
Mcdonald Amy S
Home Financials for this Owner
Home Financials are based on the most recent Mortgage that was taken out on this home.
Original Mortgage
$60,000
Interest Rate
7.15%
Purchase Details
Closed on
Dec 15, 1993
Sold by
Wilkin Matthew C
Bought by
Paulson Dan A and Paulson Patricia A
Home Financials for this Owner
Home Financials are based on the most recent Mortgage that was taken out on this home.
Original Mortgage
$81,500
Interest Rate
7.09%
Create a Home Valuation Report for This Property
The Home Valuation Report is an in-depth analysis detailing your home's value as well as a comparison with similar homes in the area
Home Values in the Area
Average Home Value in this Area
Purchase History
| Date | Buyer | Sale Price | Title Company |
|---|---|---|---|
| Pease Larry | -- | Paramount Title Corp | |
| Pease Larry K | -- | Backman Stewart Title Servic | |
| Pease Larry K | -- | -- | |
| Mcdonald Amy S | -- | -- | |
| Paulson Dan A | -- | -- |
Source: Public Records
Mortgage History
| Date | Status | Borrower | Loan Amount |
|---|---|---|---|
| Open | Pease Larry | $121,000 | |
| Previous Owner | Pease Larry K | $116,500 | |
| Previous Owner | Mcdonald Amy S | $60,000 | |
| Previous Owner | Paulson Dan A | $81,500 |
Source: Public Records
Tax History Compared to Growth
Tax History
| Year | Tax Paid | Tax Assessment Tax Assessment Total Assessment is a certain percentage of the fair market value that is determined by local assessors to be the total taxable value of land and additions on the property. | Land | Improvement |
|---|---|---|---|---|
| 2025 | $2,449 | $459,100 | $170,900 | $288,200 |
| 2024 | $2,449 | $467,200 | $161,700 | $305,500 |
| 2023 | $2,449 | $447,600 | $155,500 | $292,100 |
| 2022 | $2,691 | $464,400 | $152,500 | $311,900 |
| 2021 | $2,503 | $391,000 | $117,000 | $274,000 |
| 2020 | $1,975 | $293,700 | $106,400 | $187,300 |
| 2019 | $2,021 | $282,800 | $100,200 | $182,600 |
| 2018 | $1,883 | $256,600 | $100,200 | $156,400 |
| 2017 | $1,390 | $241,200 | $100,200 | $141,000 |
| 2016 | $858 | $225,200 | $82,100 | $143,100 |
| 2015 | $2,045 | $234,900 | $84,500 | $150,400 |
| 2014 | $1,977 | $225,300 | $82,900 | $142,400 |
Source: Public Records
Map
Nearby Homes
- 915 E 600 S
- 531 S 900 E Unit B3
- 543 S 900 E Unit A11
- 606 S 900 E
- 525 S 900 E Unit B2
- 504 S 900 E
- 515 S 1000 E Unit 706
- 515 S 1000 E Unit 406
- 515 S 1000 E Unit 1104
- 515 S 1000 E Unit 504
- 552 S Mcclelland St
- 551 S Mcclelland St
- 827 E 500 S
- 426 S 1000 E Unit 600
- 426 S 1000 E Unit 707
- 425 S 1000 E Unit 204C
- 938 E Lowell Ave
- 717 S 800 E
- 1044 E 400 S Unit 407A
- 1011 E 800 S
- 563 S 900 E
- 575 S 900 E
- 555 S 900 E
- 917 E 600 S
- 545 S 900 E Unit 531A1
- 933 E 600 S
- 568 S 900 E
- 570 S 900 E
- 566 S 900 E
- 531 S 900 E Unit A9
- 531 S 900 E Unit A14
- 531 S 900 E Unit A17
- 531 S 900 E Unit C9
- 531 S 900 E Unit C1
- 531 S 900 E Unit A16
- 531 S 900 E Unit A2
- 531 S 900 E Unit A5
- 531 S 900 E Unit B9
- 531 S 900 E Unit C8
- 531 S 900 E Unit A8