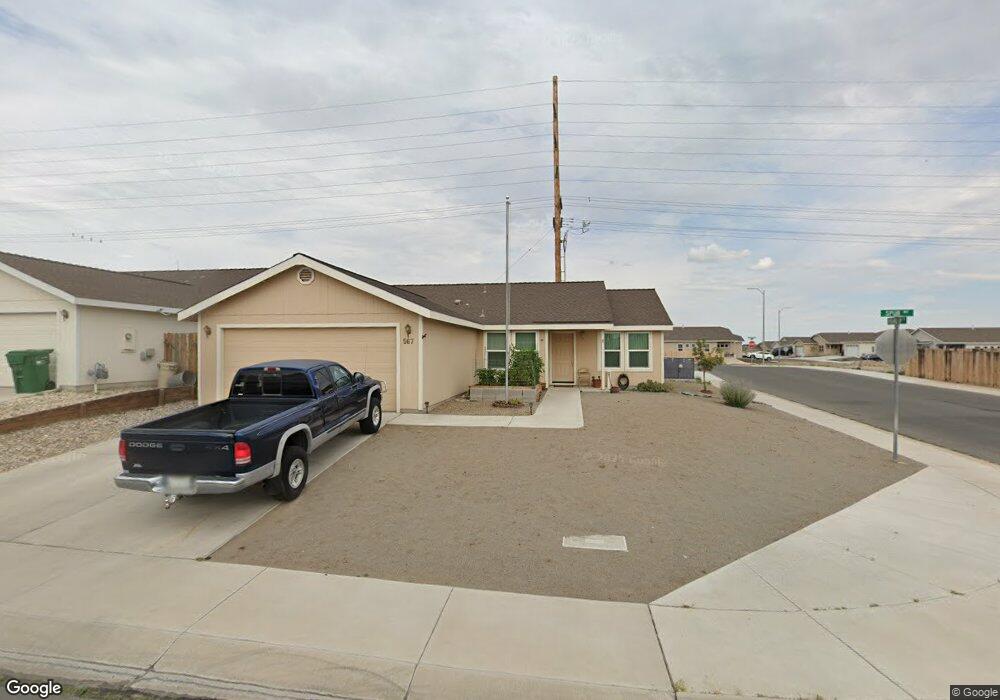
567 Spur Way Fernley, NV 89408
Estimated Value: $363,459 - $371,000
4
Beds
2
Baths
1,519
Sq Ft
$243/Sq Ft
Est. Value
About This Home
This home is located at 567 Spur Way, Fernley, NV 89408 and is currently estimated at $368,365, approximately $242 per square foot. 567 Spur Way is a home located in Lyon County with nearby schools including East Valley Elementary School, Fernley Intermediate School, and Fernley High School.
Ownership History
Date
Name
Owned For
Owner Type
Purchase Details
Closed on
Nov 18, 2009
Sold by
Deutsche Bank National Trust Company
Bought by
Kryling Michael H
Current Estimated Value
Home Financials for this Owner
Home Financials are based on the most recent Mortgage that was taken out on this home.
Original Mortgage
$76,516
Outstanding Balance
$49,654
Interest Rate
4.88%
Mortgage Type
FHA
Estimated Equity
$318,711
Purchase Details
Closed on
Sep 18, 2009
Sold by
Lavasse Marvin C and Vernon Thomas F
Bought by
Deutsche Bank National Trust Company
Purchase Details
Closed on
Nov 10, 2005
Sold by
River Ranch Estates Llc
Bought by
Lavasse Marvin C and Vernon Thomas F
Home Financials for this Owner
Home Financials are based on the most recent Mortgage that was taken out on this home.
Original Mortgage
$211,500
Interest Rate
5.97%
Mortgage Type
New Conventional
Create a Home Valuation Report for This Property
The Home Valuation Report is an in-depth analysis detailing your home's value as well as a comparison with similar homes in the area
Home Values in the Area
Average Home Value in this Area
Purchase History
| Date | Buyer | Sale Price | Title Company |
|---|---|---|---|
| Kryling Michael H | $89,100 | Ticor Title Of Nevada Inc | |
| Deutsche Bank National Trust Company | $88,500 | Accommodation | |
| Lavasse Marvin C | $235,000 | Title Service & Escrow |
Source: Public Records
Mortgage History
| Date | Status | Borrower | Loan Amount |
|---|---|---|---|
| Open | Kryling Michael H | $76,516 | |
| Previous Owner | Lavasse Marvin C | $211,500 |
Source: Public Records
Tax History Compared to Growth
Tax History
| Year | Tax Paid | Tax Assessment Tax Assessment Total Assessment is a certain percentage of the fair market value that is determined by local assessors to be the total taxable value of land and additions on the property. | Land | Improvement |
|---|---|---|---|---|
| 2025 | $1,416 | $105,122 | $43,750 | $61,373 |
| 2024 | $1,784 | $105,458 | $43,750 | $61,707 |
| 2023 | $1,784 | $101,520 | $43,750 | $57,770 |
| 2022 | $1,681 | $97,043 | $43,750 | $53,293 |
| 2021 | $1,669 | $86,669 | $34,650 | $52,019 |
| 2020 | $1,627 | $84,310 | $34,650 | $49,660 |
| 2019 | $1,608 | $79,296 | $31,500 | $47,796 |
| 2018 | $1,577 | $67,666 | $21,000 | $46,666 |
| 2017 | $1,576 | $59,764 | $13,130 | $46,634 |
| 2016 | $1,391 | $46,176 | $5,780 | $40,396 |
| 2015 | $1,426 | $36,330 | $5,780 | $30,550 |
| 2014 | $1,396 | $27,819 | $5,780 | $22,039 |
Source: Public Records
Map
Nearby Homes
- 1844 Fort Sutter Blvd Unit Lot 5
- 1848 Fort Sutter Blvd Unit Lot 6
- 4520 Mifflin St Unit Lot 1
- 4531 Mifflin St Unit Lot 28
- Topaz Plan at Nevada Sky
- Tahoe Plan at Nevada Sky
- Washoe Plan at Nevada Sky
- 4535 Mifflin St Unit Lot 27
- 357 Emigrant Way
- 4543 Mifflin St
- 4543 Mifflin St Unit Lot 25
- 4552 Mifflin St Unit Lot 9
- 4555 Mifflin St Unit Lot 22
- 021 46103
- 1075 Browne Ln
- 400 Fort Sutter Blvd
- APN 021-191-08
- 2119 Fort Bridger Rd
- 2187 Snow Drift Rd
- 2129 Fort Bridger Rd
- 565 Spur Way Unit 3
- 569 Spur Way
- 563 Spur Way Unit 3
- 1824 Fort Sutter Blvd
- 1700 Round up Rd Unit 3
- 1820 Fort Sutter Blvd
- 1649 Meadows Ave
- 561 Spur Way Unit 3
- 1699 Round up Rd
- 1698 Round up Rd
- 1816 Fort Sutter Blvd
- 1647 Meadows Ave
- 573 Spur Way
- 1697 Round up Rd Unit 3
- 559 Spur Ct
- 4515 Rutledge St
- 1696 Round up Rd
- 4514 Madison Rd
- 1812 Fort Sutter Blvd
- 1695 Round up Rd