567 Trace Cir Unit 101 Deerfield Beach, FL 33441
Village at Tivoli NeighborhoodEstimated Value: $202,447 - $224,000
3
Beds
2
Baths
887
Sq Ft
$242/Sq Ft
Est. Value
About This Home
This home is located at 567 Trace Cir Unit 101, Deerfield Beach, FL 33441 and is currently estimated at $214,612, approximately $241 per square foot. 567 Trace Cir Unit 101 is a home located in Broward County with nearby schools including Deerfield Park Elementary School, Deerfield Beach Middle School, and Deerfield Beach High School.
Ownership History
Date
Name
Owned For
Owner Type
Purchase Details
Closed on
Sep 28, 2004
Sold by
Hernandez Henry
Bought by
Daub Bradley C
Current Estimated Value
Home Financials for this Owner
Home Financials are based on the most recent Mortgage that was taken out on this home.
Original Mortgage
$96,000
Outstanding Balance
$46,076
Interest Rate
5.73%
Mortgage Type
Purchase Money Mortgage
Estimated Equity
$168,536
Purchase Details
Closed on
Jul 13, 2001
Sold by
John Picone M and Doreen Picone M
Bought by
Hernandez Henry
Purchase Details
Closed on
Nov 6, 1997
Sold by
Lynch James F and Lynch Helen K
Bought by
Picone John
Home Financials for this Owner
Home Financials are based on the most recent Mortgage that was taken out on this home.
Original Mortgage
$52,600
Interest Rate
7.31%
Mortgage Type
New Conventional
Purchase Details
Closed on
Jan 1, 1987
Sold by
Available Not
Bought by
Available Not
Create a Home Valuation Report for This Property
The Home Valuation Report is an in-depth analysis detailing your home's value as well as a comparison with similar homes in the area
Home Values in the Area
Average Home Value in this Area
Purchase History
| Date | Buyer | Sale Price | Title Company |
|---|---|---|---|
| Daub Bradley C | $125,000 | -- | |
| Hernandez Henry | $78,000 | -- | |
| Picone John | $58,500 | -- | |
| Available Not | $30,000 | -- |
Source: Public Records
Mortgage History
| Date | Status | Borrower | Loan Amount |
|---|---|---|---|
| Open | Daub Bradley C | $96,000 | |
| Previous Owner | Picone John | $52,600 |
Source: Public Records
Tax History
| Year | Tax Paid | Tax Assessment Tax Assessment Total Assessment is a certain percentage of the fair market value that is determined by local assessors to be the total taxable value of land and additions on the property. | Land | Improvement |
|---|---|---|---|---|
| 2026 | $894 | $52,480 | -- | -- |
| 2025 | $842 | $51,110 | -- | -- |
| 2024 | $795 | $49,670 | -- | -- |
| 2023 | $795 | $48,230 | $0 | $0 |
| 2022 | $740 | $46,830 | $0 | $0 |
| 2021 | $654 | $45,470 | $0 | $0 |
| 2020 | $641 | $44,850 | $0 | $0 |
| 2019 | $623 | $43,850 | $0 | $0 |
| 2018 | $544 | $43,040 | $0 | $0 |
| 2017 | $532 | $42,160 | $0 | $0 |
| 2016 | $522 | $41,300 | $0 | $0 |
| 2015 | $527 | $41,020 | $0 | $0 |
| 2014 | $527 | $40,700 | $0 | $0 |
| 2013 | -- | $48,980 | $4,900 | $44,080 |
Source: Public Records
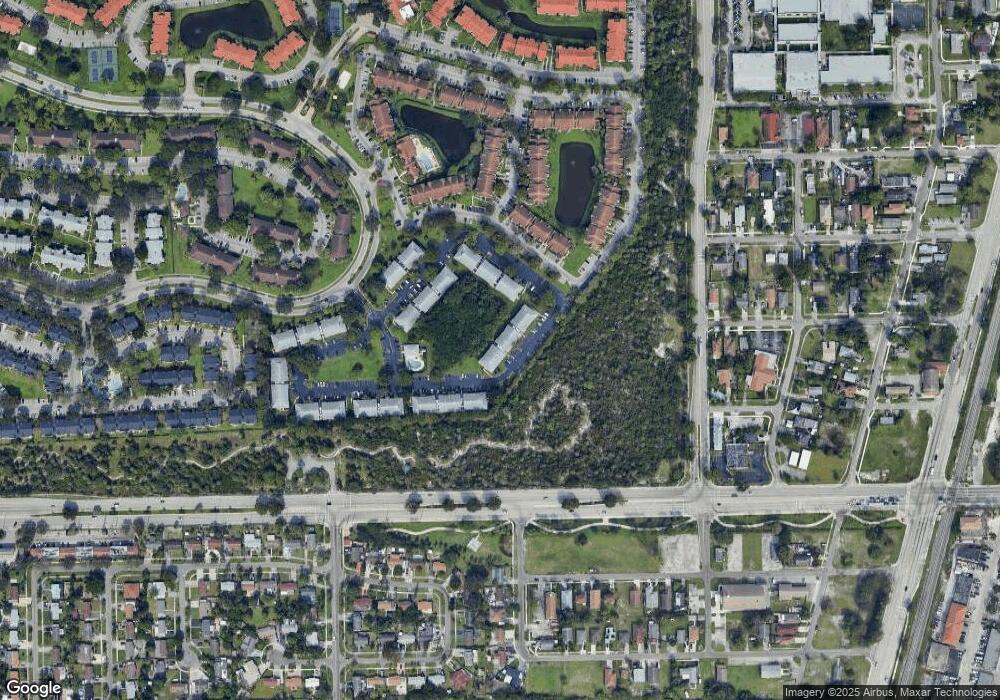
Map
Nearby Homes
- 567 Trace Cir Unit 104
- 567 Trace Cir
- 588 Trace Cir Unit 211
- 522 Trace Cir Unit 209
- 610 Trace Cir Unit 206
- 523 Trace Cir Unit 105
- 632 Trace Cir Unit 202
- 677 Trace Cir Unit 203
- 1041 SW 4th Terrace
- 351 SW 10th Ct
- 224 SW 10th St
- 770 SW 2nd Ave
- 1260 SW 6th Ave
- 1333 S Dixie Hwy Unit 202
- 1333 S Dixie Hwy Unit 222
- 410 SW Natura Ave
- 412 SW Natura Ave
- 437 SW Natura Ave Unit F
- 1330 SW 6th Terrace
- 520 SW 13th Place
- 567 Tivoli Trace Cir Unit 202
- 567 Trace Cir Unit 102-6
- 567 Tivoli Trace Cir Unit 211
- 567 Tivoli Trace Cir Unit 204
- 567 Tivoli Trace Cir Unit 102
- 567 Tivoli Trace Cir Unit 205
- 567 Tivoli Trace Cir Unit 206
- 567 Trace Cir Unit 2056
- 567 Trace Cir Unit 202-6
- 567 Tivoli Trace Cir Unit 105
- 567 Trace Cir Unit 108
- 567 Trace Cir Unit 209
- 567 Trace Cir Unit 203
- 567 Trace Cir Unit 109
- 567 Trace Cir Unit 105
- 567 Trace Cir Unit 212
- 567 Trace Cir Unit 204
- 567 Trace Cir Unit 103
- 567 Trace Cir Unit 202
- 567 Trace Cir Unit 110
Your Personal Tour Guide
Ask me questions while you tour the home.