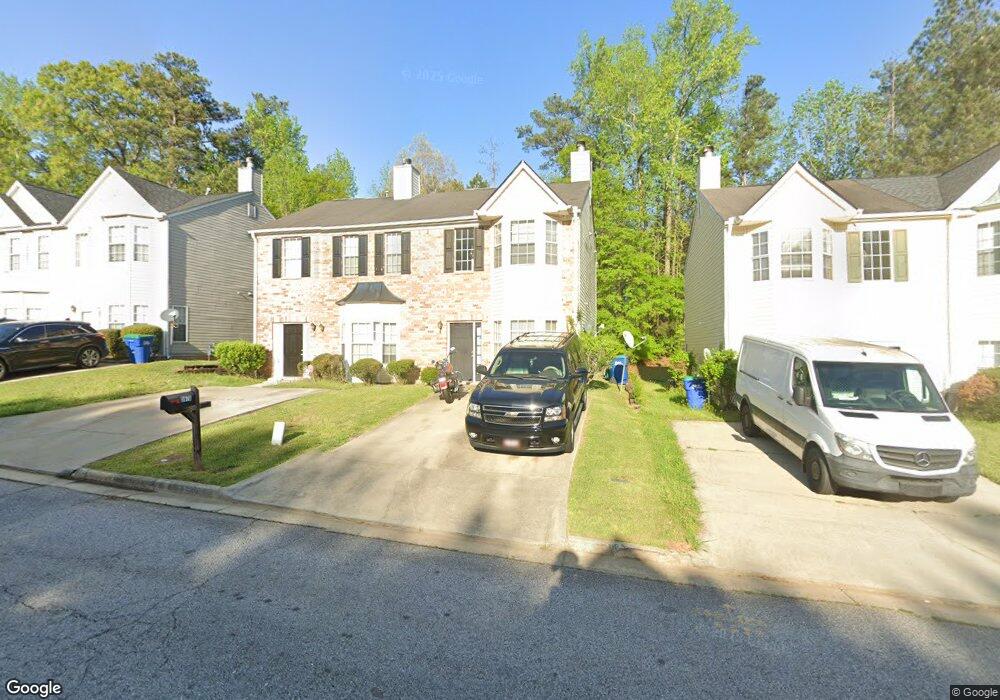
5670 Hampton Ct Atlanta, GA 30349
Estimated Value: $162,000 - $205,000
2
Beds
3
Baths
1,168
Sq Ft
$150/Sq Ft
Est. Value
About This Home
This home is located at 5670 Hampton Ct, Atlanta, GA 30349 and is currently estimated at $175,654, approximately $150 per square foot. 5670 Hampton Ct is a home located in Fulton County with nearby schools including Mcnair Middle School, Banneker High School, and Hapeville Charter Career Academy.
Ownership History
Date
Name
Owned For
Owner Type
Purchase Details
Closed on
Sep 23, 2019
Sold by
Barnes Cassandra D
Bought by
Nmgi Llc
Current Estimated Value
Purchase Details
Closed on
Sep 3, 2004
Sold by
Hoppie Melissa N
Bought by
Stanford Devara
Home Financials for this Owner
Home Financials are based on the most recent Mortgage that was taken out on this home.
Original Mortgage
$106,270
Interest Rate
5.78%
Mortgage Type
VA
Purchase Details
Closed on
Jun 22, 2001
Sold by
Whitt Paul L and Whitt Dorothy L
Bought by
Barnes Cassandra D
Home Financials for this Owner
Home Financials are based on the most recent Mortgage that was taken out on this home.
Original Mortgage
$96,485
Interest Rate
7.23%
Mortgage Type
FHA
Purchase Details
Closed on
Jul 25, 2000
Sold by
Homeland Legacy Inc
Bought by
Whitt Paul L and Whitt Dorothy L
Home Financials for this Owner
Home Financials are based on the most recent Mortgage that was taken out on this home.
Original Mortgage
$89,518
Interest Rate
8.12%
Mortgage Type
New Conventional
Create a Home Valuation Report for This Property
The Home Valuation Report is an in-depth analysis detailing your home's value as well as a comparison with similar homes in the area
Home Values in the Area
Average Home Value in this Area
Purchase History
We collect this data history from publicly available records. To have your information removed, we recommend requesting removal directly through your county’s website.
| Date | Buyer | Sale Price | Title Company |
|---|---|---|---|
| Nmgi Llc | $90,000 | -- | |
| Stanford Devara | $108,000 | -- | |
| Barnes Cassandra D | $98,000 | -- | |
| Whitt Paul L | $90,700 | -- |
Source: Public Records
Mortgage History
We collect this data history from publicly available records. To have your information removed, we recommend requesting removal directly through your county’s website.
| Date | Status | Borrower | Loan Amount |
|---|---|---|---|
| Previous Owner | Stanford Devara | $106,270 | |
| Previous Owner | Barnes Cassandra D | $96,485 | |
| Previous Owner | Whitt Paul L | $89,518 |
Source: Public Records
Tax History
| Year | Tax Paid | Tax Assessment Tax Assessment Total Assessment is a certain percentage of the fair market value that is determined by local assessors to be the total taxable value of land and additions on the property. | Land | Improvement |
|---|---|---|---|---|
| 2025 | $2,592 | $70,880 | $15,800 | $55,080 |
| 2023 | $1,695 | $60,040 | $12,760 | $47,280 |
| 2022 | $1,869 | $47,680 | $7,040 | $40,640 |
| 2021 | $1,603 | $40,040 | $7,640 | $32,400 |
| 2020 | $1,465 | $36,000 | $4,200 | $31,800 |
| 2019 | $216 | $22,800 | $3,640 | $19,160 |
| 2018 | $366 | $22,280 | $3,560 | $18,720 |
| 2017 | $213 | $13,280 | $2,160 | $11,120 |
| 2016 | $212 | $13,280 | $2,160 | $11,120 |
| 2015 | $213 | $13,280 | $2,160 | $11,120 |
| 2014 | $213 | $13,280 | $2,160 | $11,120 |
Source: Public Records
Map
Nearby Homes
- 5675 Hampton Ct
- 2575 Picardy Cir N Unit B
- 5910 Hampton Ct
- 435 Burdett Ridge Ct
- 1505 Camelot Dr Unit 1505A
- 1505 Camelot Dr
- 1314 Camelot Dr
- 2840 Two Lake Cir
- 2816 Two Lakes Cir
- 5490 Twin Lakes Dr Unit 1
- 5770 Deerfield Trail
- 2370 Burdett Ridge Dr
- 5700 Deerfield Trail
- 2828 The Meadows Way
- 619 Camelot Dr
- 120 Camelot Dr
- 5726 Southwick Ct SW
- 103 Camelot Dr
- 0 Jerome Rd Unit 10574417
- 2662 Alderbrook Ct
- 5660 Hampton Ct
- 5660 Hampton Ct Unit 5660
- 5650 Hampton Ct
- 5640 Hampton Ct
- 5710 Hampton Ct
- 5630 Hampton Ct
- 5720 Hampton Ct
- 5620 Hampton Ct
- 5730 Hampton Ct
- 5635 Hampton Ct
- 5635 Hampton Ct Unit 5635
- 5645 Hampton Ct
- 5610 Hampton Ct
- 5625 Hampton Ct
- 5655 Hampton Ct
- 5615 Hampton Ct
- 5665 Hampton Ct
- 5605 Hampton Ct
- 5740 Hampton Ct
- 5600 Hampton Ct
Your Personal Tour Guide
Ask me questions while you tour the home.