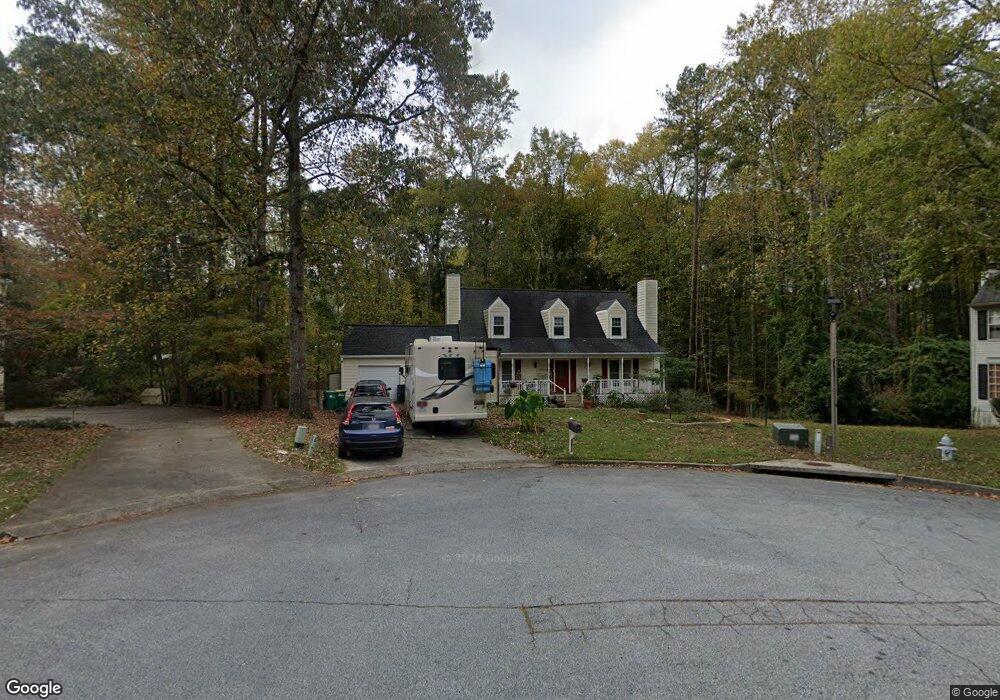
5670 Knox Ct Unit IV Norcross, GA 30092
Estimated Value: $563,000 - $612,449
4
Beds
3
Baths
1,144
Sq Ft
$508/Sq Ft
Est. Value
About This Home
This home is located at 5670 Knox Ct Unit IV, Norcross, GA 30092 and is currently estimated at $581,362, approximately $508 per square foot. 5670 Knox Ct Unit IV is a home located in Gwinnett County with nearby schools including Simpson Elementary School, Pinckneyville Middle School, and Norcross High School.
Ownership History
Date
Name
Owned For
Owner Type
Purchase Details
Closed on
Jan 27, 2017
Sold by
Halulka Brandon M
Bought by
Krumbach Paul A and Krumbach Catherine P
Current Estimated Value
Home Financials for this Owner
Home Financials are based on the most recent Mortgage that was taken out on this home.
Original Mortgage
$228,000
Outstanding Balance
$188,505
Interest Rate
4.32%
Mortgage Type
New Conventional
Estimated Equity
$392,857
Purchase Details
Closed on
Apr 14, 2008
Sold by
Callahan Douglas and Callahan Audrey
Bought by
Halulka Brandon M
Home Financials for this Owner
Home Financials are based on the most recent Mortgage that was taken out on this home.
Original Mortgage
$200,000
Interest Rate
6.03%
Mortgage Type
New Conventional
Purchase Details
Closed on
Jun 24, 1999
Sold by
Mcdermott Kristen
Bought by
Callahan Douglas
Create a Home Valuation Report for This Property
The Home Valuation Report is an in-depth analysis detailing your home's value as well as a comparison with similar homes in the area
Home Values in the Area
Average Home Value in this Area
Purchase History
| Date | Buyer | Sale Price | Title Company |
|---|---|---|---|
| Krumbach Paul A | $285,000 | -- | |
| Halulka Brandon M | $287,500 | -- | |
| Callahan Douglas | $166,500 | -- |
Source: Public Records
Mortgage History
| Date | Status | Borrower | Loan Amount |
|---|---|---|---|
| Open | Krumbach Paul A | $228,000 | |
| Previous Owner | Halulka Brandon M | $200,000 | |
| Previous Owner | Callahan Douglas | $166,500 |
Source: Public Records
Tax History Compared to Growth
Tax History
| Year | Tax Paid | Tax Assessment Tax Assessment Total Assessment is a certain percentage of the fair market value that is determined by local assessors to be the total taxable value of land and additions on the property. | Land | Improvement |
|---|---|---|---|---|
| 2025 | $1,621 | $244,760 | $38,000 | $206,760 |
| 2024 | $1,616 | $200,160 | $40,000 | $160,160 |
| 2023 | $1,616 | $182,280 | $36,400 | $145,880 |
| 2022 | $1,605 | $158,320 | $32,800 | $125,520 |
| 2021 | $1,600 | $141,880 | $26,240 | $115,640 |
| 2020 | $1,595 | $134,400 | $26,000 | $108,400 |
| 2019 | $1,458 | $134,400 | $26,000 | $108,400 |
| 2018 | $1,448 | $114,000 | $24,000 | $90,000 |
| 2016 | $2,917 | $89,680 | $24,000 | $65,680 |
| 2015 | $2,915 | $89,680 | $24,000 | $65,680 |
| 2014 | $2,727 | $86,720 | $24,000 | $62,720 |
Source: Public Records
Map
Nearby Homes
- 5545 Fitzpatrick Terrace
- 5465 Fort Fisher Way
- 5465 Fort Fisher Way
- 5863 Revington Dr
- 5221 W Jones Bridge Rd
- 4531 Outer Bank Dr
- 5397 Valley Mist Ct
- 5350 Wickershire Dr
- 5440 Clinchfield Trail
- 5885 Match Point
- 5354 Fox Hill Dr
- 5961 Ranger Ct
- 5649 Whitesburg Ct
- 5970 Rachel Ridge Unit 2
- 6040 Neely Farm Dr Unit 3
- 4053 Spalding Hollow NW
- 4916 Sudbrook Way Unit 253
- The Adams Plan at Waterside - Condos
- 4457 Watervale Way Unit 292
- 4477 Watervale Way Unit 286
- 5670 Knox Ct
- 5660 Knox Ct
- 5680 Knox Ct
- 5650 Knox Ct
- 5669 Knox Ct
- 4642 Walden Trace Unit 9
- 4632 Walden Trace Unit 9
- 5649 Knox Ct
- 5640 Knox Ct
- 5648 Shawn Terrace Unit 5
- 5639 Knox Ct Unit IV
- 0 Knox Ct Unit 8861544
- 0 Knox Ct Unit 8198853
- 5597 Fitzpatrick Trace
- 5597 Fitzpatrick Trace Unit 5597
- 4622 Walden Trace
- 0 Fitzpatrick Trace Unit 3178176
- 0 Fitzpatrick Trace
- 0 Walden Trace
- 5630 Knox Ct